> ## Documentation Index
> Fetch the complete documentation index at: https://moengage.com/docs/llms.txt
> Use this file to discover all available pages before exploring further.
# Decisioning Agent Analytics
> Learn how to evaluate your AI Agent's performance using the Decisioning Agent Analytics dashboard, including measuring engagement uplift and analyzing optimization trends across channels.
This is an Early Access feature. To enable it for your account, please contact your MoEngage Customer Success Manager (CSM) or the Support team.
# Overview
The Decisioning Agent Analytics page provides a centralized view to evaluate your AI Agent’s performance across multiple campaigns. It measures the "Incremental Value" of AI by comparing a **Agent Treatment Group** versus the **Agent Control Group**.
Use this UI to:
* Track how the AI adapts to user behavior in real-time.
* Quantify the impact of AI-optimized delivery and timing.
* Identify which channels and campaigns drive the highest engagement uplift.
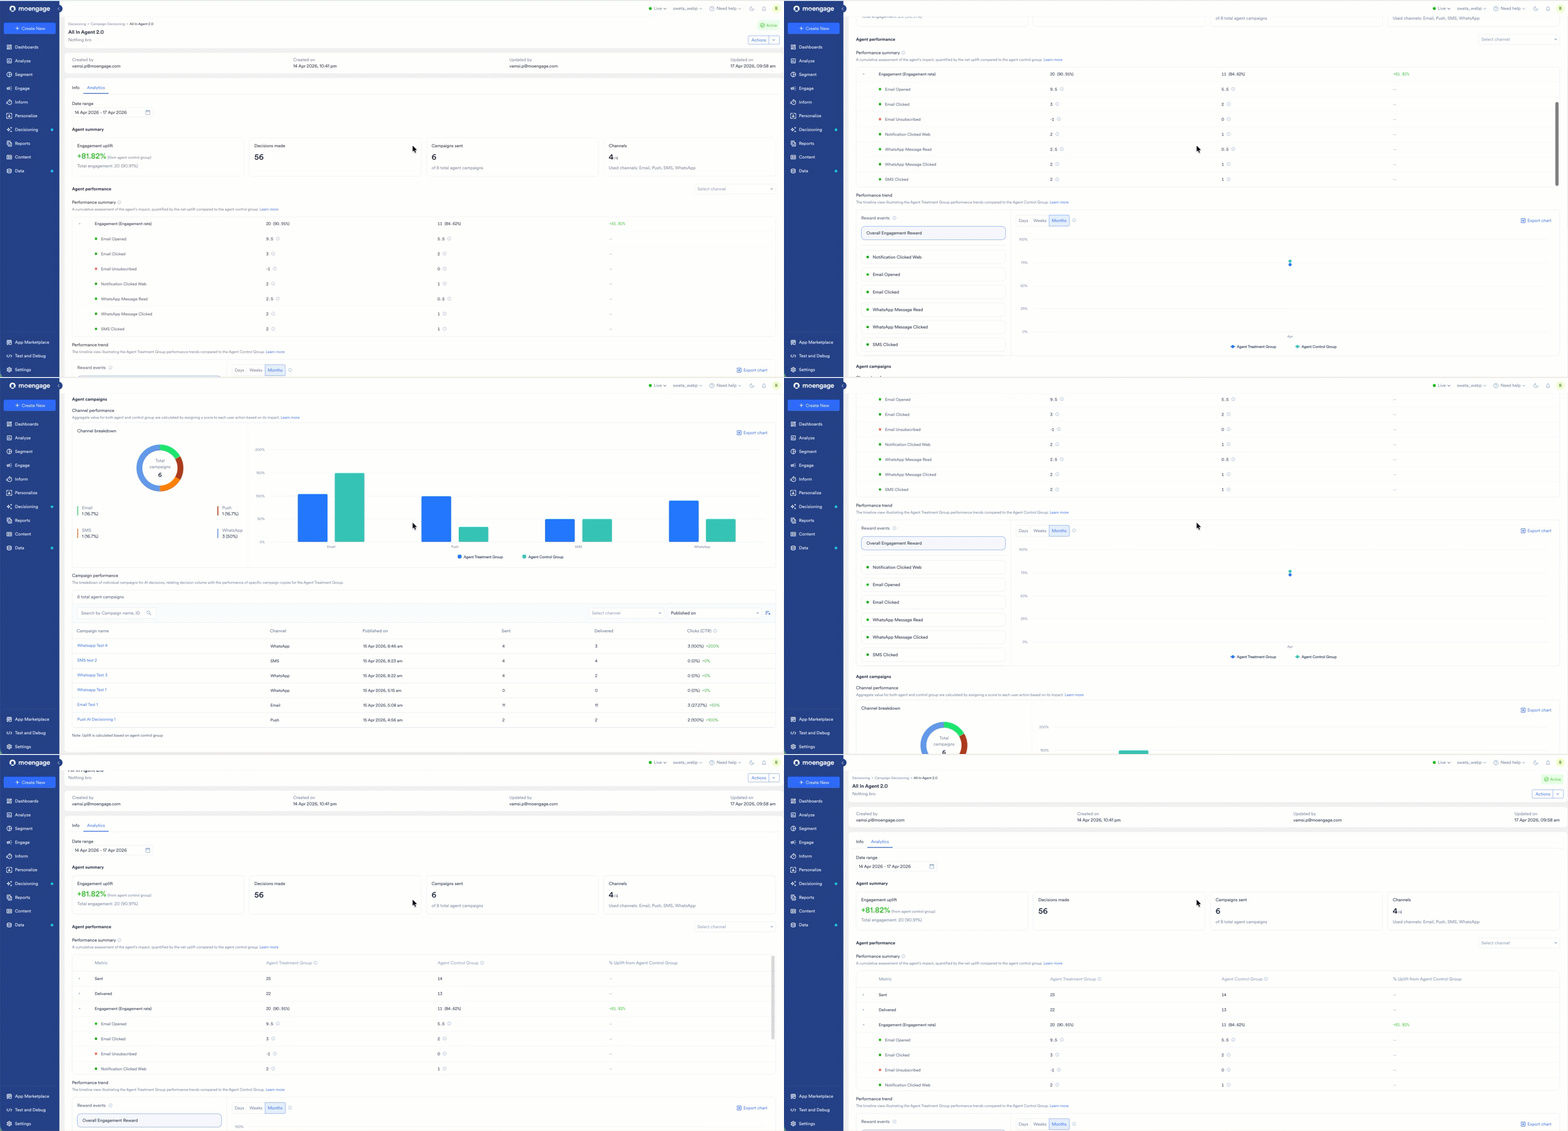
The following image shows the Decisioning Agent Analytics UI:
 **Information**
MoEngage calculates and displays all metrics based on the timezone configured in your app settings. Data is updated automatically when you change the global date range filter.
# Access the Decisioning Analytics Page
To view the performance metrics for a specific Campaign Decisioning Agent, perform the following steps:
1. On the sidebar menu in MoEngage, hover over the Decisioning menu item
**Information**
MoEngage calculates and displays all metrics based on the timezone configured in your app settings. Data is updated automatically when you change the global date range filter.
# Access the Decisioning Analytics Page
To view the performance metrics for a specific Campaign Decisioning Agent, perform the following steps:
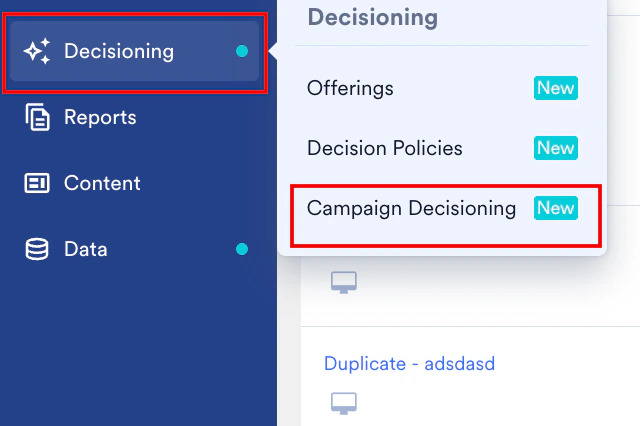
1. On the sidebar menu in MoEngage, hover over the Decisioning menu item  . The **Decisioning** menu appears.
2. Click **Campaign Decisioning**.
. The **Decisioning** menu appears.
2. Click **Campaign Decisioning**.
The **Campaign Decisioning** page appears.
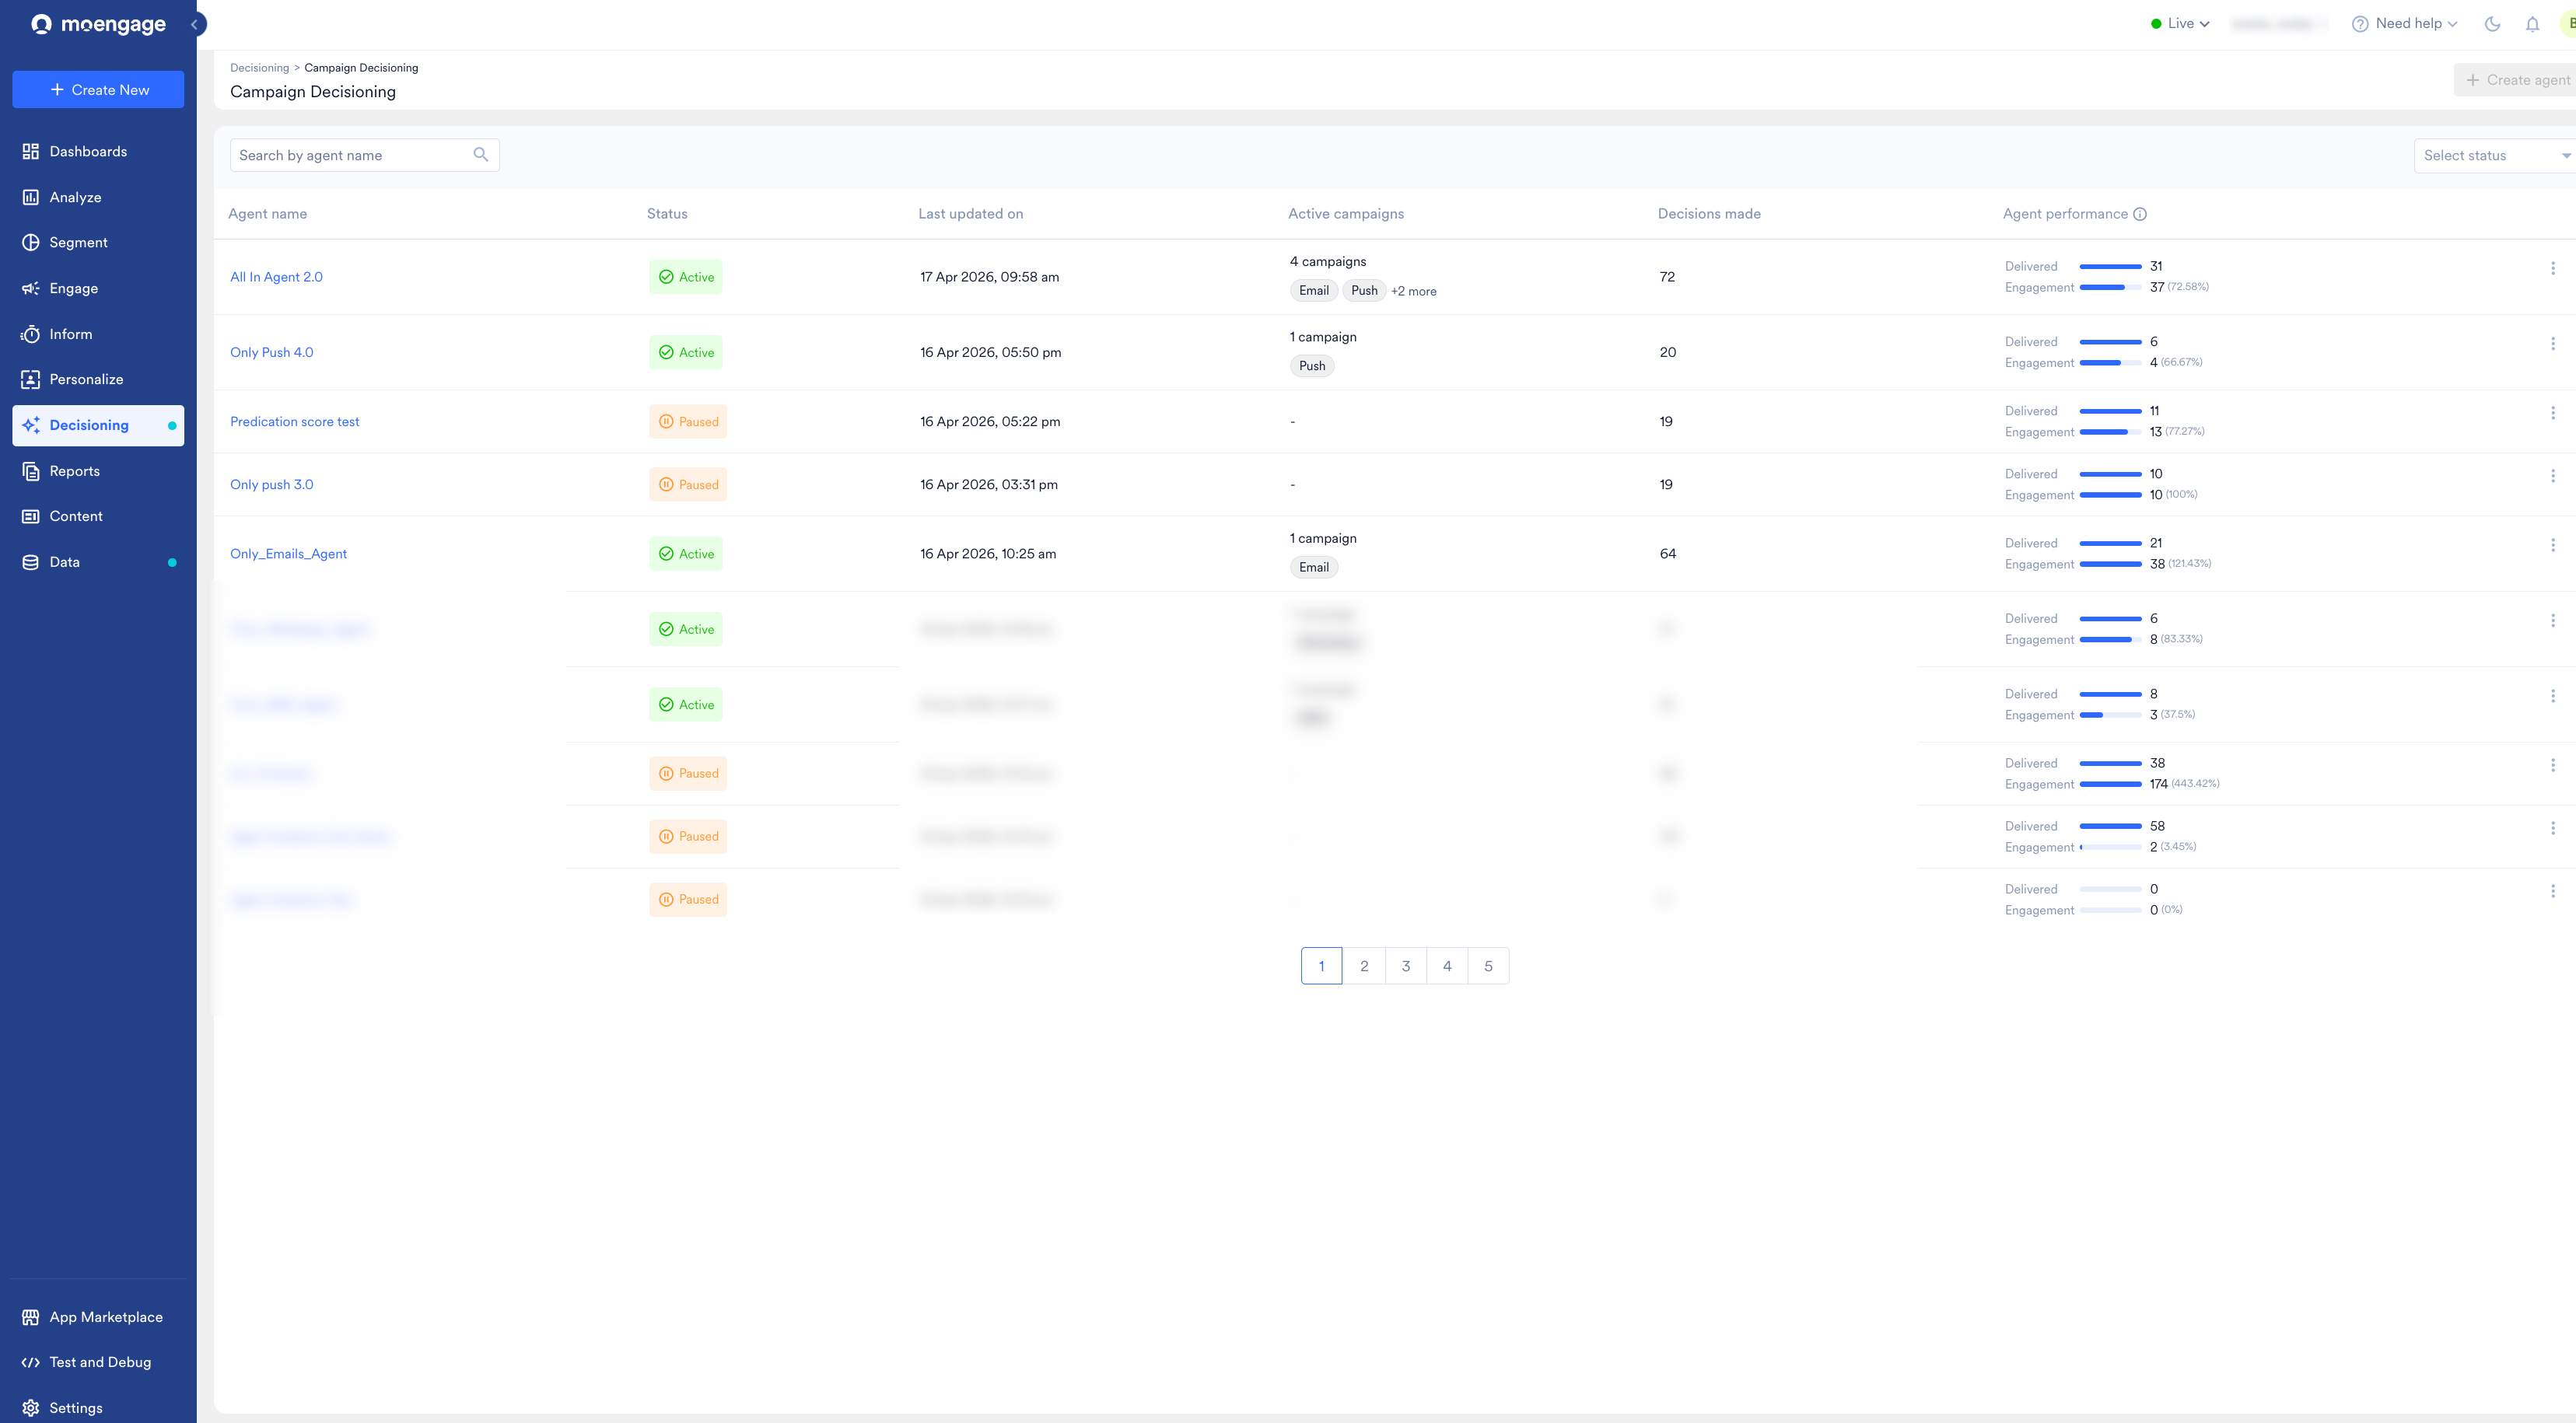 3. From the list, click the Agent you want to analyze.
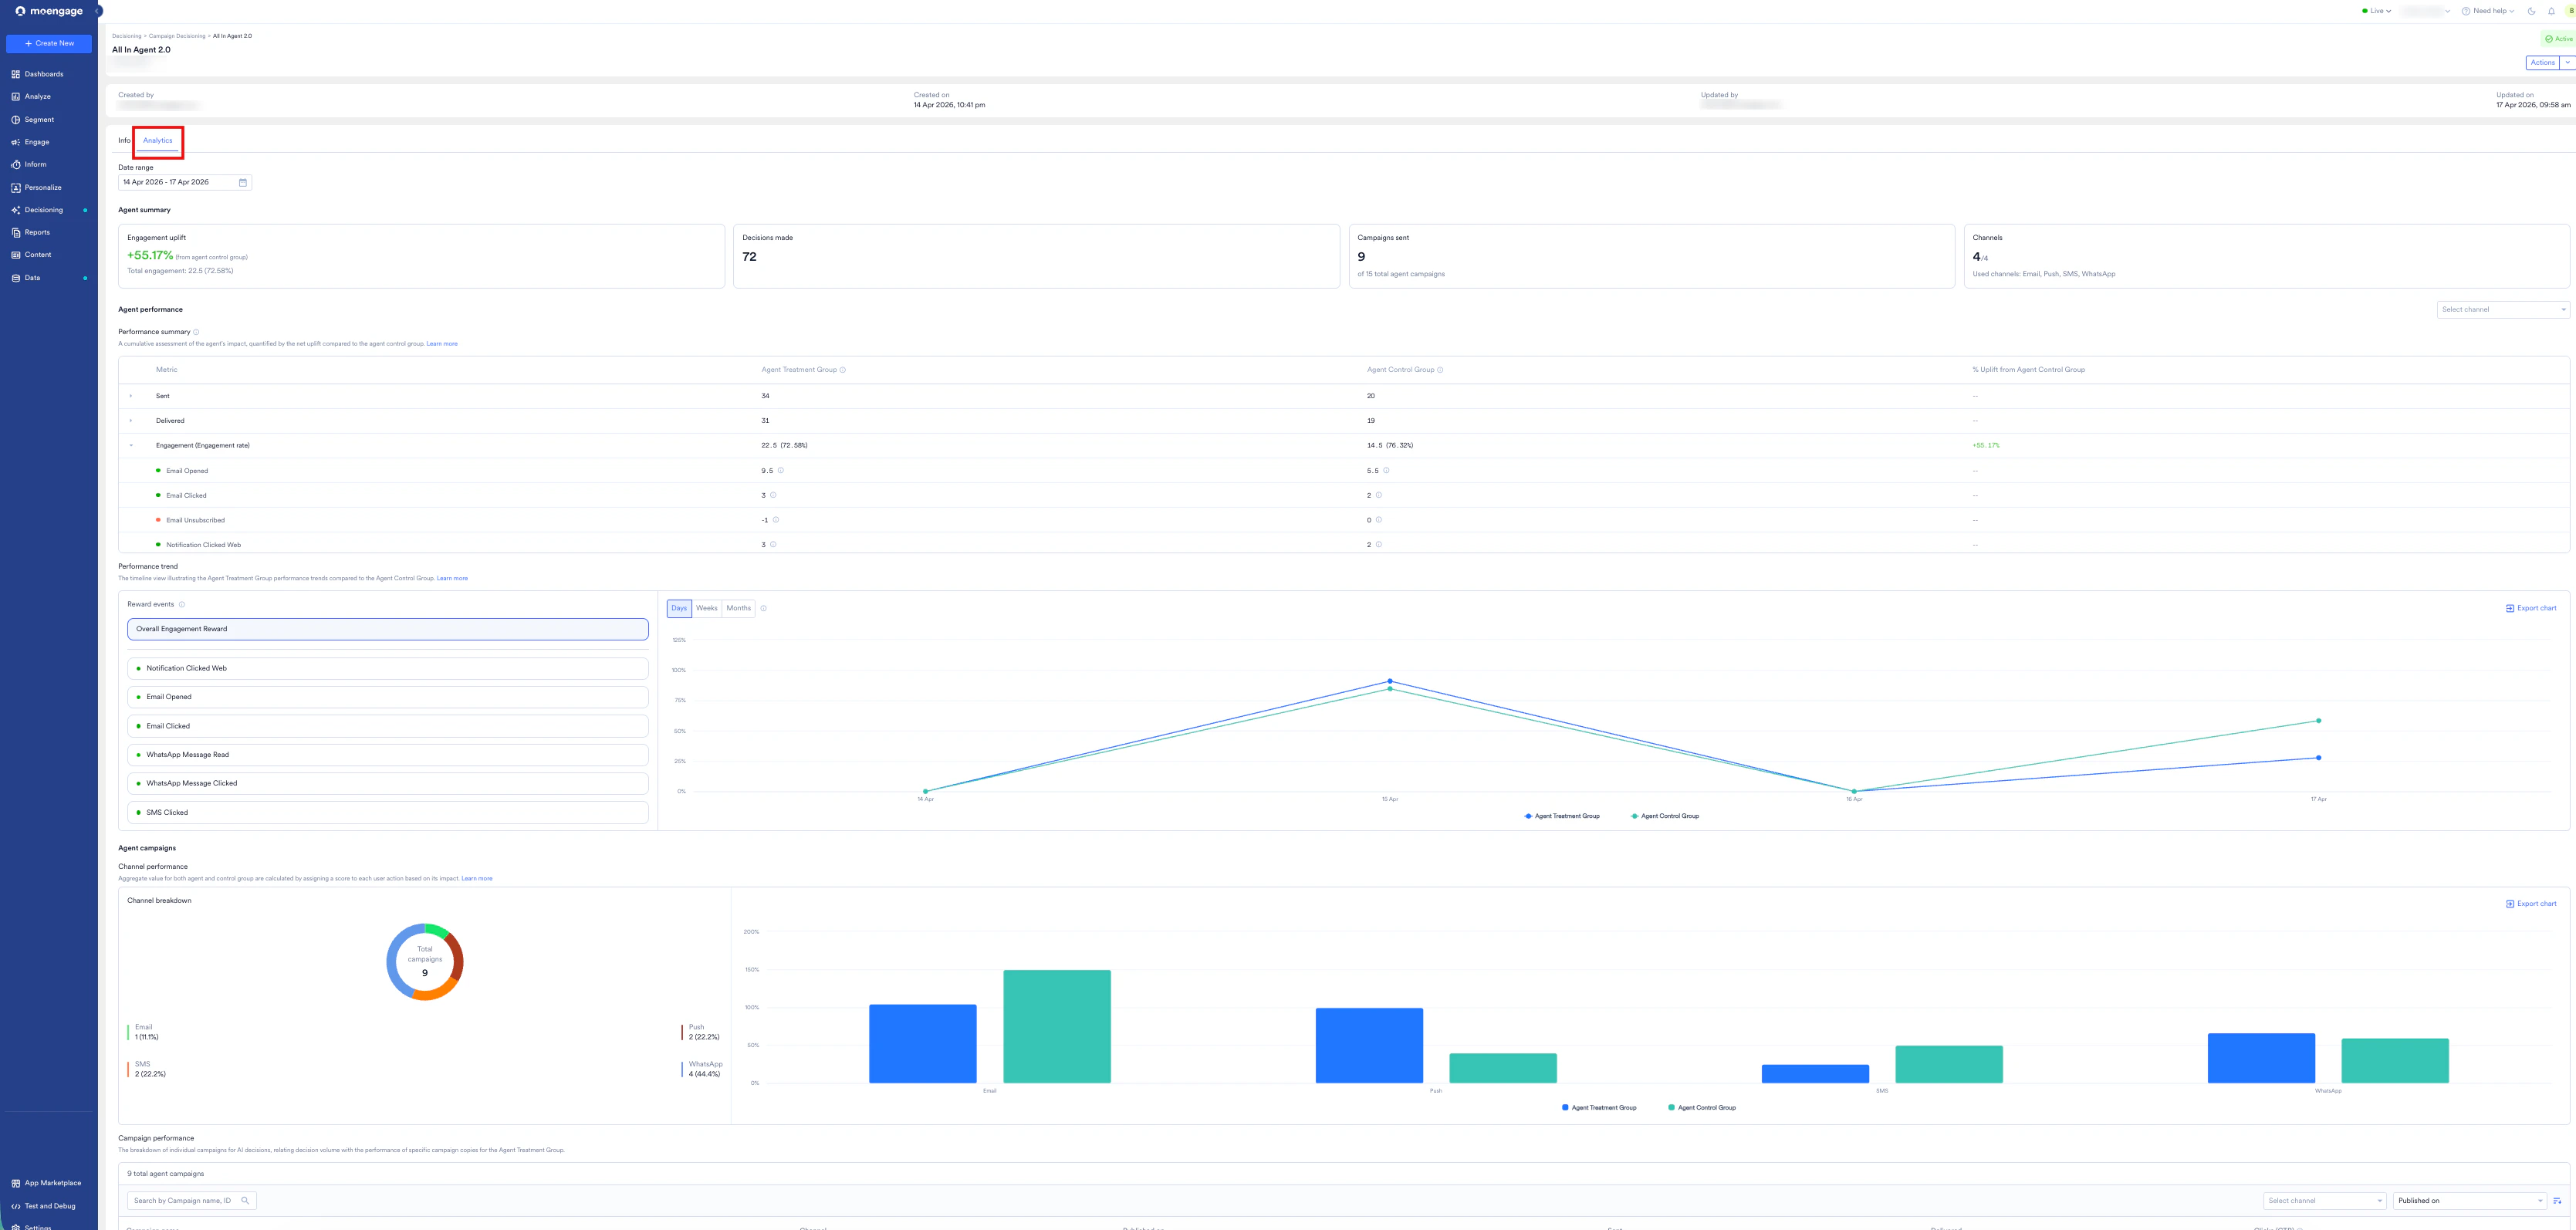
4. Click the **Analytics** tab.
3. From the list, click the Agent you want to analyze.
4. Click the **Analytics** tab.
 ## Terms to Know
Refer to the following glossary for information on the entities related to Decisioning Agent Analytics:
| Term | Description |
| :-------------------- | :--------------------------------------------------------------------------------------------------------------------------------------------------------------------------------------------------------------------------------------------------------------------------------------------------- |
| Engagement Uplift | Percentage increase in engagement rate achieved by the agent treatment group compared to the agent control group. |
| Weightage Score | Cumulative value derived by assigning specific points to user actions (Rewards) as defined during Agent creation. |
| Audience | Total population defined for AI optimization, providing a broad dataset to analyze intent and maximize long-term value. This differs from the Campaign Segment, which serves as a tactical guardrail to ensure message relevance. |
| Exploration | Mechanism that delivers wildcard campaign options to small traffic subsets to gather data on new strategies. This process solves the "cold start" problem for fresh assets and helps the Agent adapt to evolving user interests and market trends. |
| Reward event | Classification of user actions as positive or negative "signals" to calibrate the Agent’s intelligence. Positive events (for example, purchases or clicks) represent successful outcomes to maximize, while negative events (for example, uninstalls) represent friction that it learns to minimize. |
| Agent Treatment Group | Users who receive campaigns based on AI-optimized timing and delivery decisions. |
| Agent Control Group | Randomly selected group of users who receive campaigns without AI optimization to serve as a baseline for measuring AI incremental impact. |
# Analyze Agent Performance
The **Analytics** tab allows you to visualize data patterns and validate the effectiveness of your AI strategy. This section explains how to use the filters and controls to interpret your data.
## Step 1: Filter Your Performance Data
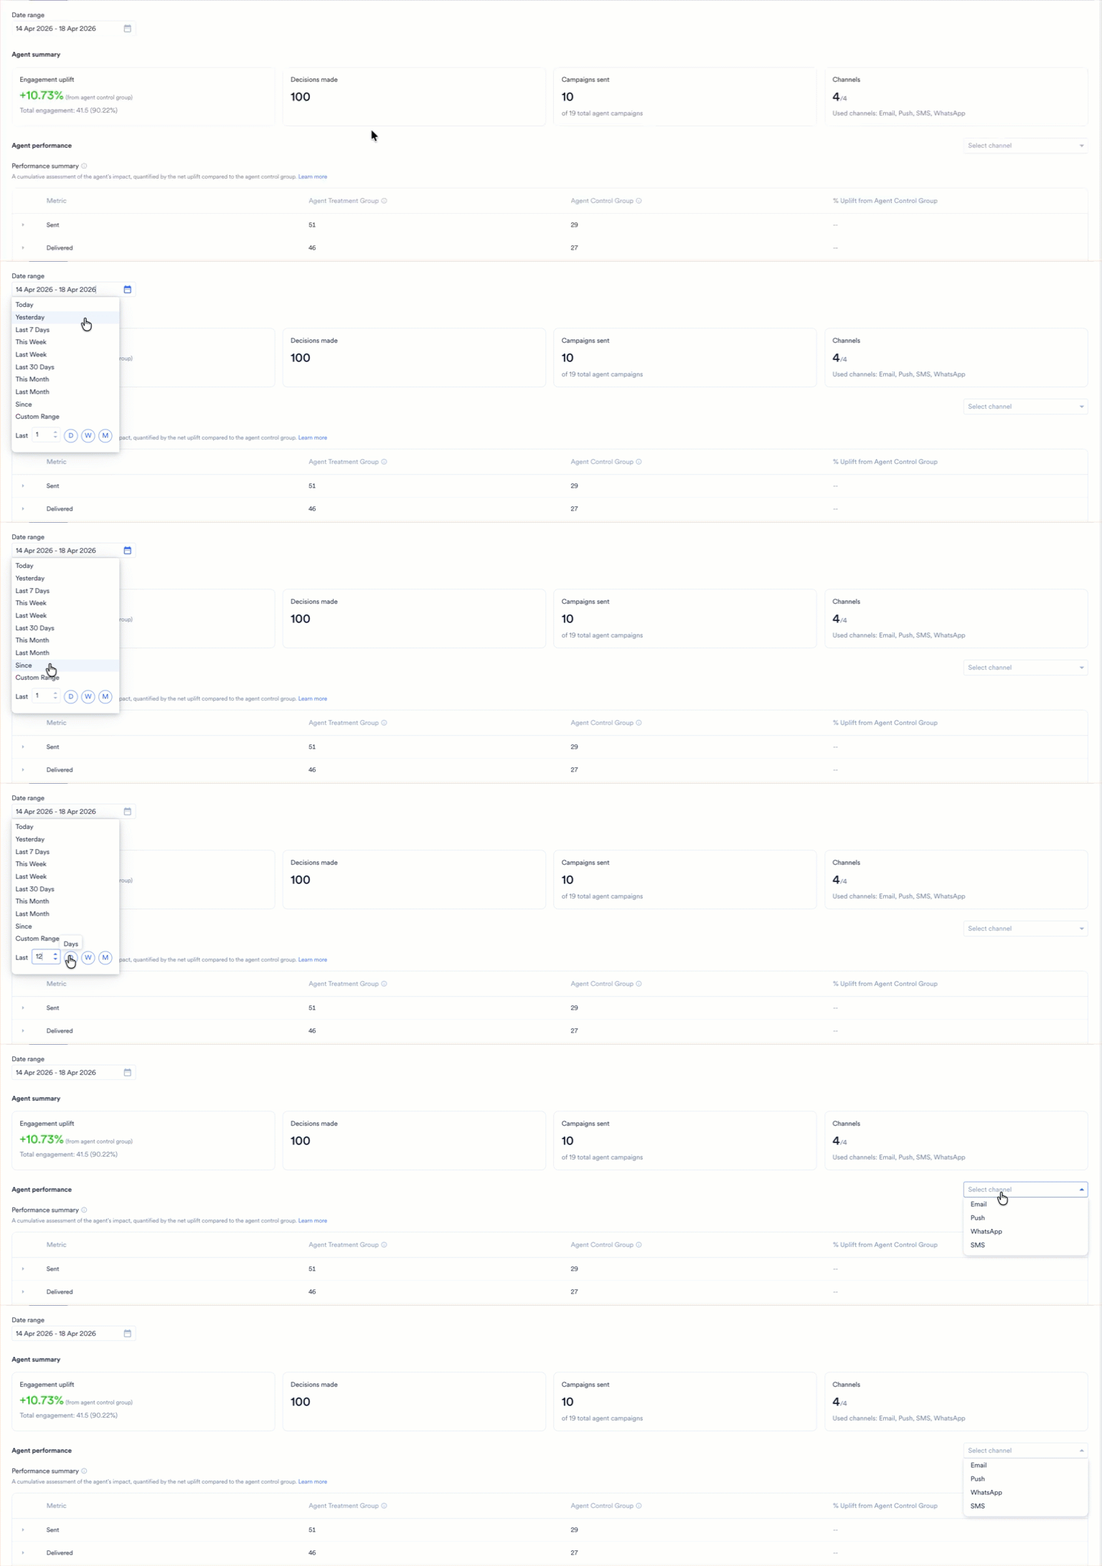
Select the data you want to analyze using the following filters at the top of the page:
* **Date Range**: Define the time period for the analysis. You can select predefined options such as **Today**, **Yesterday**, **Last 7 Days**, **Last 30 Days**, **This Week**, **Last Week**, **This Month**, **Last Month**, or **Since**. To define a specific duration, select **Custom Range**. You can also view a rolling duration by entering a number in the **Last input** box and clicking **D** (days), **W** (weeks), or **M** (months). All summary cards and charts on the page are updated automatically to reflect your selection.
* **Select Channel**: Choose a specific platform (**Email**, **Push**, **SMS**, or **WhatsApp**) to isolate performance metrics for that channel.
## Terms to Know
Refer to the following glossary for information on the entities related to Decisioning Agent Analytics:
| Term | Description |
| :-------------------- | :--------------------------------------------------------------------------------------------------------------------------------------------------------------------------------------------------------------------------------------------------------------------------------------------------- |
| Engagement Uplift | Percentage increase in engagement rate achieved by the agent treatment group compared to the agent control group. |
| Weightage Score | Cumulative value derived by assigning specific points to user actions (Rewards) as defined during Agent creation. |
| Audience | Total population defined for AI optimization, providing a broad dataset to analyze intent and maximize long-term value. This differs from the Campaign Segment, which serves as a tactical guardrail to ensure message relevance. |
| Exploration | Mechanism that delivers wildcard campaign options to small traffic subsets to gather data on new strategies. This process solves the "cold start" problem for fresh assets and helps the Agent adapt to evolving user interests and market trends. |
| Reward event | Classification of user actions as positive or negative "signals" to calibrate the Agent’s intelligence. Positive events (for example, purchases or clicks) represent successful outcomes to maximize, while negative events (for example, uninstalls) represent friction that it learns to minimize. |
| Agent Treatment Group | Users who receive campaigns based on AI-optimized timing and delivery decisions. |
| Agent Control Group | Randomly selected group of users who receive campaigns without AI optimization to serve as a baseline for measuring AI incremental impact. |
# Analyze Agent Performance
The **Analytics** tab allows you to visualize data patterns and validate the effectiveness of your AI strategy. This section explains how to use the filters and controls to interpret your data.
## Step 1: Filter Your Performance Data
Select the data you want to analyze using the following filters at the top of the page:
* **Date Range**: Define the time period for the analysis. You can select predefined options such as **Today**, **Yesterday**, **Last 7 Days**, **Last 30 Days**, **This Week**, **Last Week**, **This Month**, **Last Month**, or **Since**. To define a specific duration, select **Custom Range**. You can also view a rolling duration by entering a number in the **Last input** box and clicking **D** (days), **W** (weeks), or **M** (months). All summary cards and charts on the page are updated automatically to reflect your selection.
* **Select Channel**: Choose a specific platform (**Email**, **Push**, **SMS**, or **WhatsApp**) to isolate performance metrics for that channel.
 ## Step 2: Review Operational Scale and Achievement
The following **Agent summary** cards provide high-level metrics that help you monitor the Agent's operational status and overall effectiveness:
* **Engagement Uplift**: Displays the net percentage increase in engagement compared to the control group.
* **Decisions Made**: Shows the total volume of individual 1:1 choices processed by the AI engine.
* **Campaigns Sent**: Lists the number of unique campaigns successfully delivered from the total eligible pool.
* **Channels**: Indicates the count of active channels currently in use (for example, 4/4).
## Step 2: Review Operational Scale and Achievement
The following **Agent summary** cards provide high-level metrics that help you monitor the Agent's operational status and overall effectiveness:
* **Engagement Uplift**: Displays the net percentage increase in engagement compared to the control group.
* **Decisions Made**: Shows the total volume of individual 1:1 choices processed by the AI engine.
* **Campaigns Sent**: Lists the number of unique campaigns successfully delivered from the total eligible pool.
* **Channels**: Indicates the count of active channels currently in use (for example, 4/4).
 ## Step 3: Analyze Performance Summary
The Performance Summary table provides a detailed comparison of the **Agent Treatment Group** versus the **Agent Control Group**. This view updates dynamically based on your global filter selections to show relevant metrics.
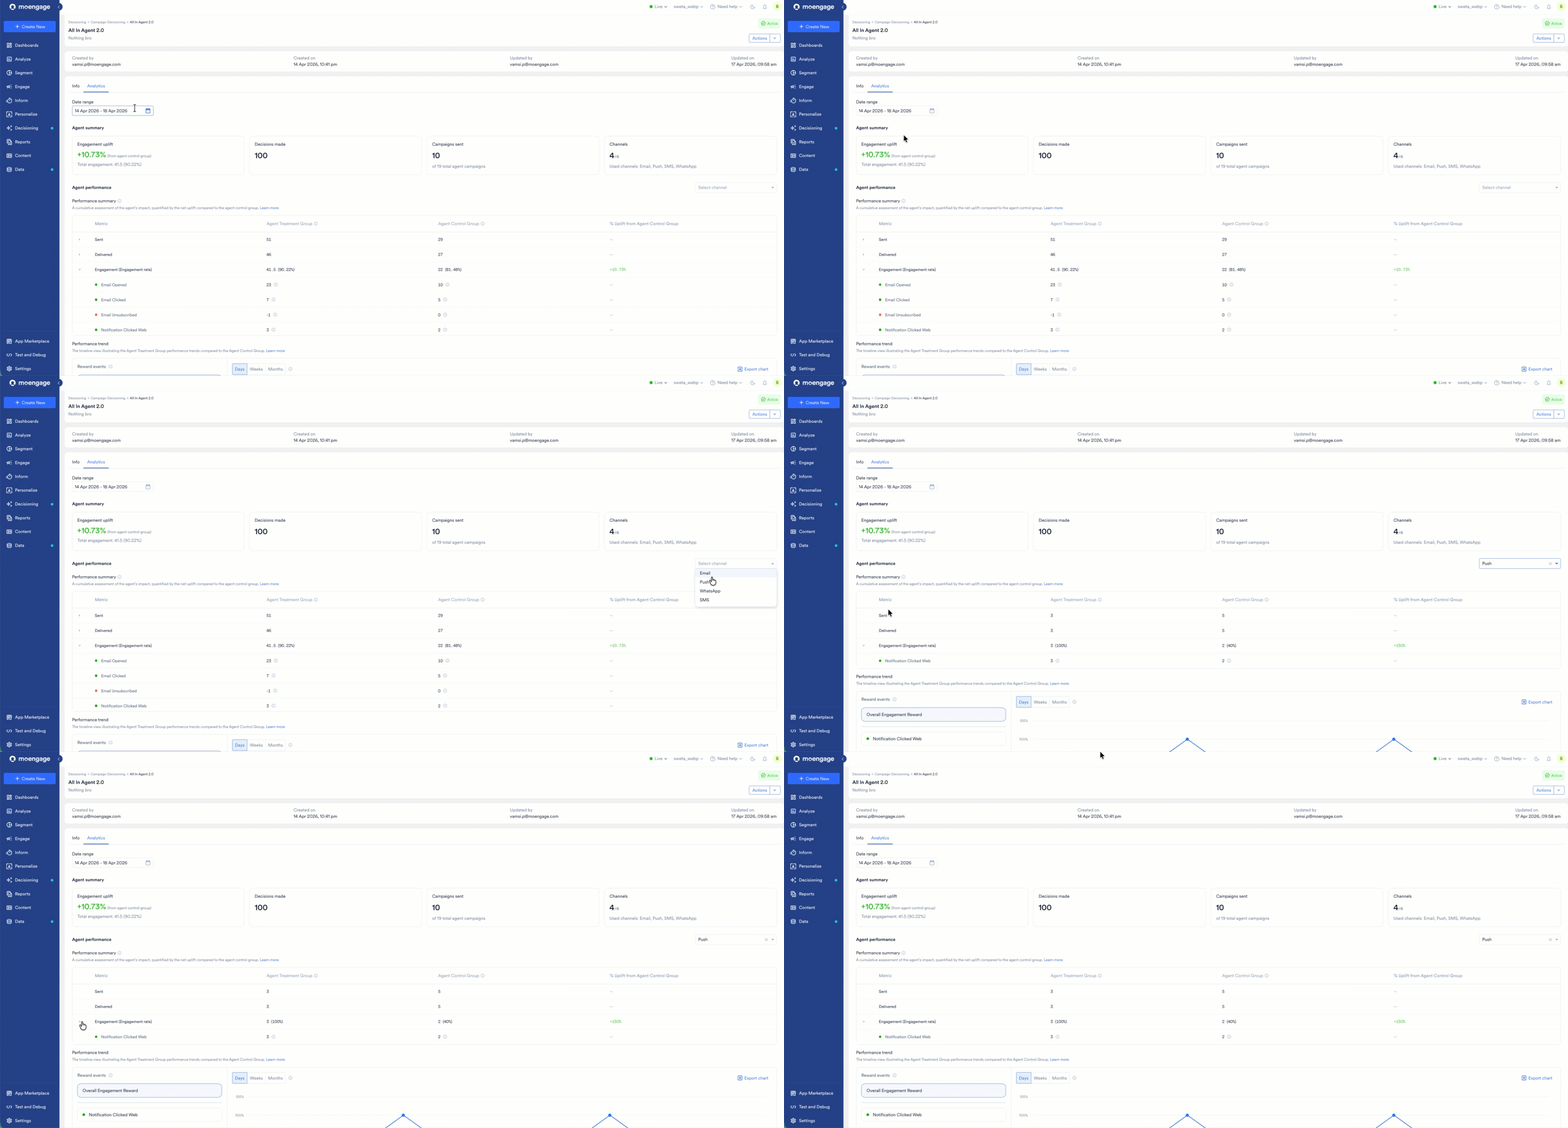
For example, to view the performance of a specific channel, perform the following steps:
1. In the **Date Range** list, select the time period you want to analyze.
2. In the **Select channel** list, select a channel (for example, **Email**). The table is updated to show reward events for that channel, such as *Email Opened* and *Email Clicked*.
3. Review the **Sent**, **Delivered**, and **Engagement** metrics for both groups.
4. Click the arrow icon
## Step 3: Analyze Performance Summary
The Performance Summary table provides a detailed comparison of the **Agent Treatment Group** versus the **Agent Control Group**. This view updates dynamically based on your global filter selections to show relevant metrics.
For example, to view the performance of a specific channel, perform the following steps:
1. In the **Date Range** list, select the time period you want to analyze.
2. In the **Select channel** list, select a channel (for example, **Email**). The table is updated to show reward events for that channel, such as *Email Opened* and *Email Clicked*.
3. Review the **Sent**, **Delivered**, and **Engagement** metrics for both groups.
4. Click the arrow icon  next to the **Engagement** row to expand and view granular event data. \
**Note**: Reward events are indicated with green dots (Positive Events) or red dots (Negative Events) as defined in your reward strategy.
next to the **Engagement** row to expand and view granular event data. \
**Note**: Reward events are indicated with green dots (Positive Events) or red dots (Negative Events) as defined in your reward strategy.
 **Formula**
* Engagement Rate = (Engagement weighted score / Number of Delivered communications) \* 100.
* Engagement uplift = ((Engagement rate of agent target group − Engagement rate of control group )/ (Engagement rate of control group))\*100.
## Step 4: Visualize Optimization Trends
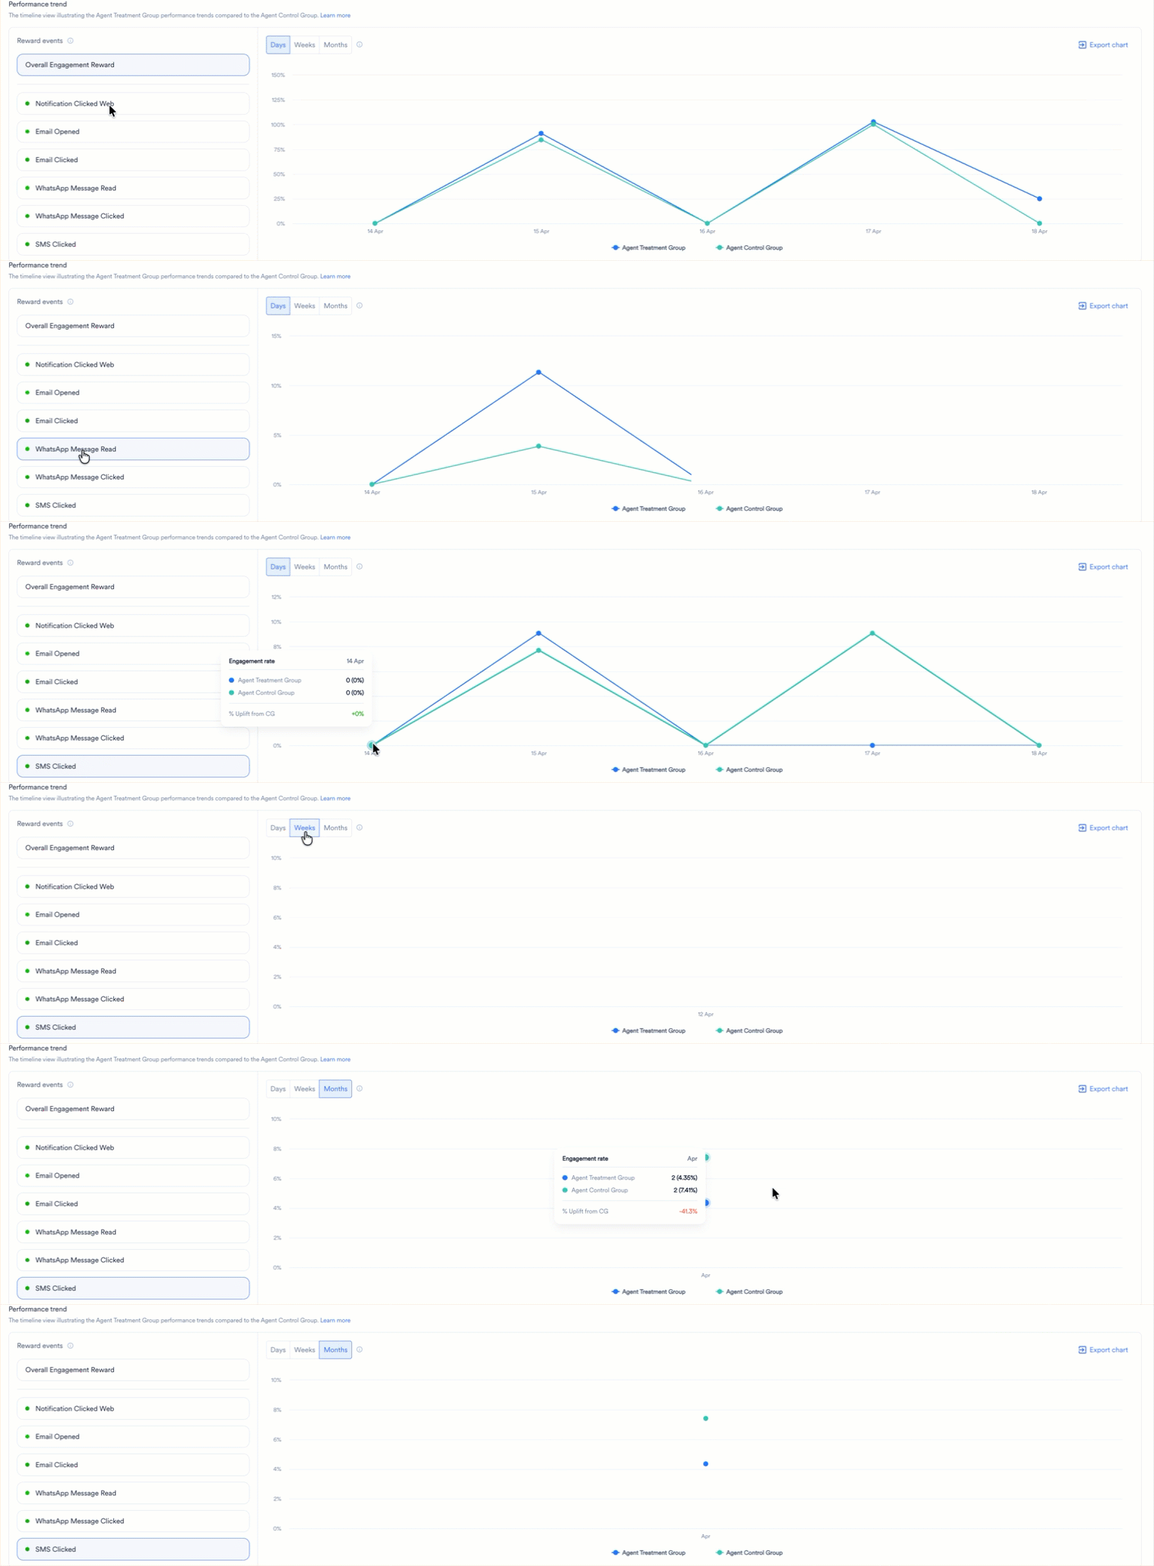
The Performance Trend section allows you to visualize how the AI model optimizes results over time.
* **Reward Selection**: Use the left sidebar to select specific events and isolate their trends in the line chart.
* **Granularity**: Switch the timeline view between **Days**, **Weeks**, or **Months**.
* **Export**: Click **Export chart** to download the current visualization as a PNG file.
**Formula**
* Engagement Rate = (Engagement weighted score / Number of Delivered communications) \* 100.
* Engagement uplift = ((Engagement rate of agent target group − Engagement rate of control group )/ (Engagement rate of control group))\*100.
## Step 4: Visualize Optimization Trends
The Performance Trend section allows you to visualize how the AI model optimizes results over time.
* **Reward Selection**: Use the left sidebar to select specific events and isolate their trends in the line chart.
* **Granularity**: Switch the timeline view between **Days**, **Weeks**, or **Months**.
* **Export**: Click **Export chart** to download the current visualization as a PNG file.
 ## Step 5: Review Channel and Campaign Performance
The channel and campaign performance sections provide the following detailed metrics that help you identify the specific segments of your strategy that drive the most impact:
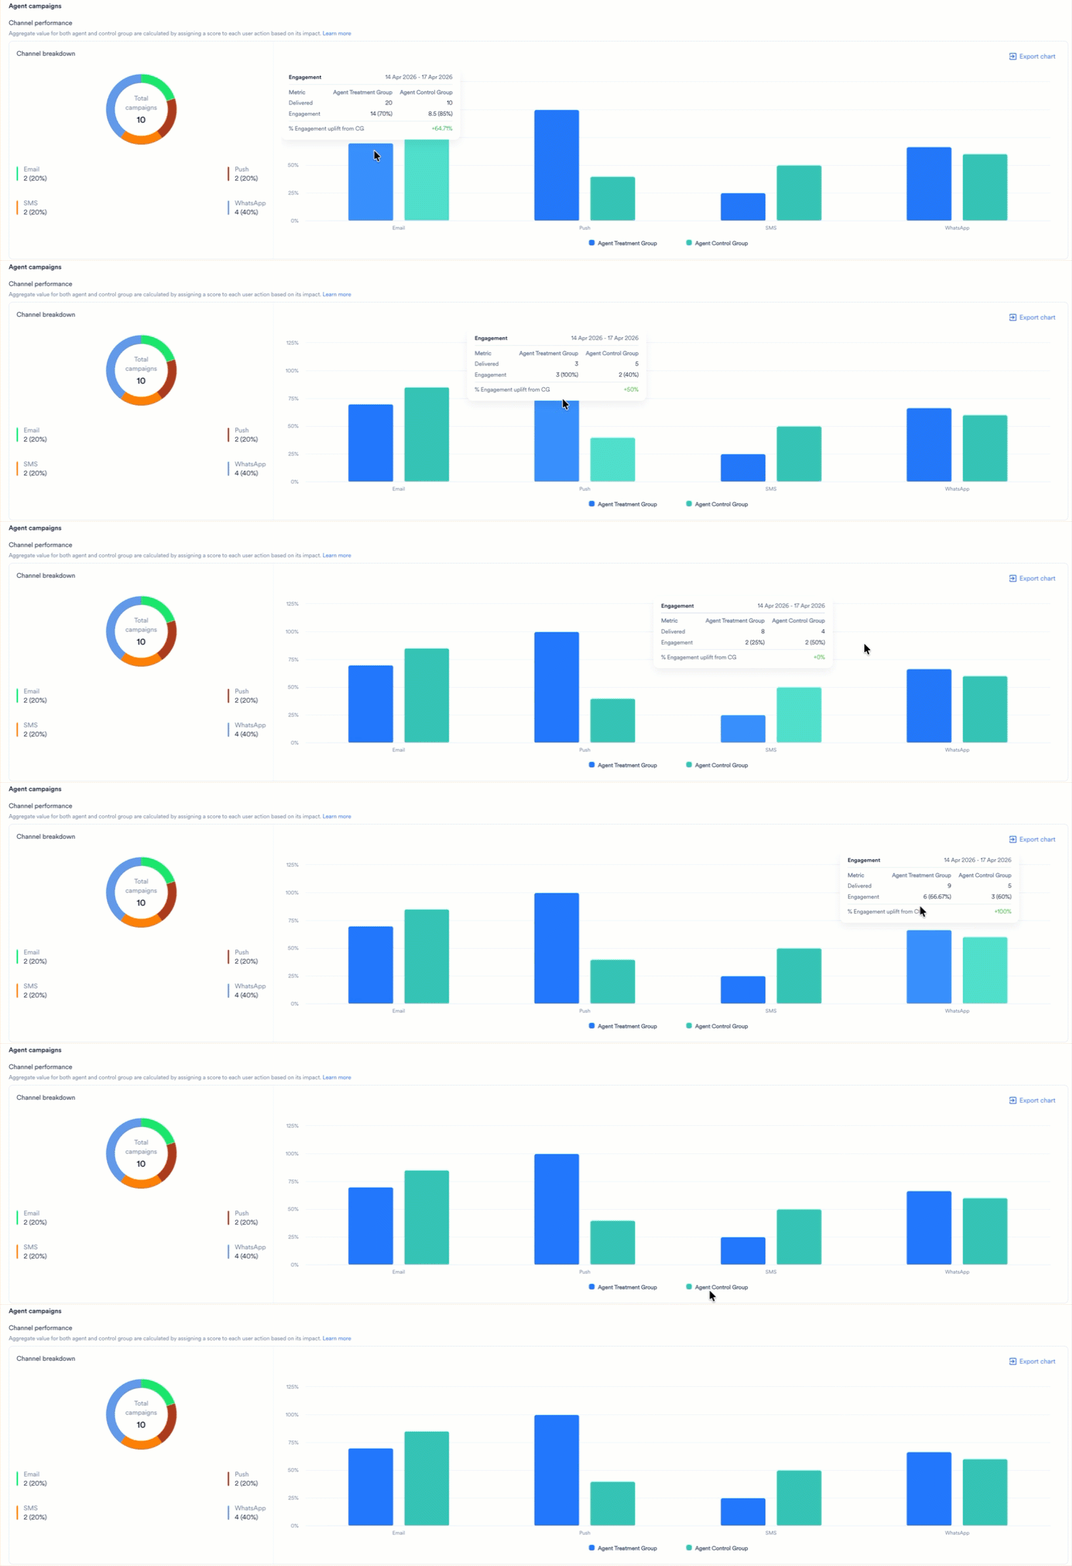
* **Channel Breakdown**: Review the donut chart to see the percentage distribution of campaigns across used channels.
## Step 5: Review Channel and Campaign Performance
The channel and campaign performance sections provide the following detailed metrics that help you identify the specific segments of your strategy that drive the most impact:
* **Channel Breakdown**: Review the donut chart to see the percentage distribution of campaigns across used channels.
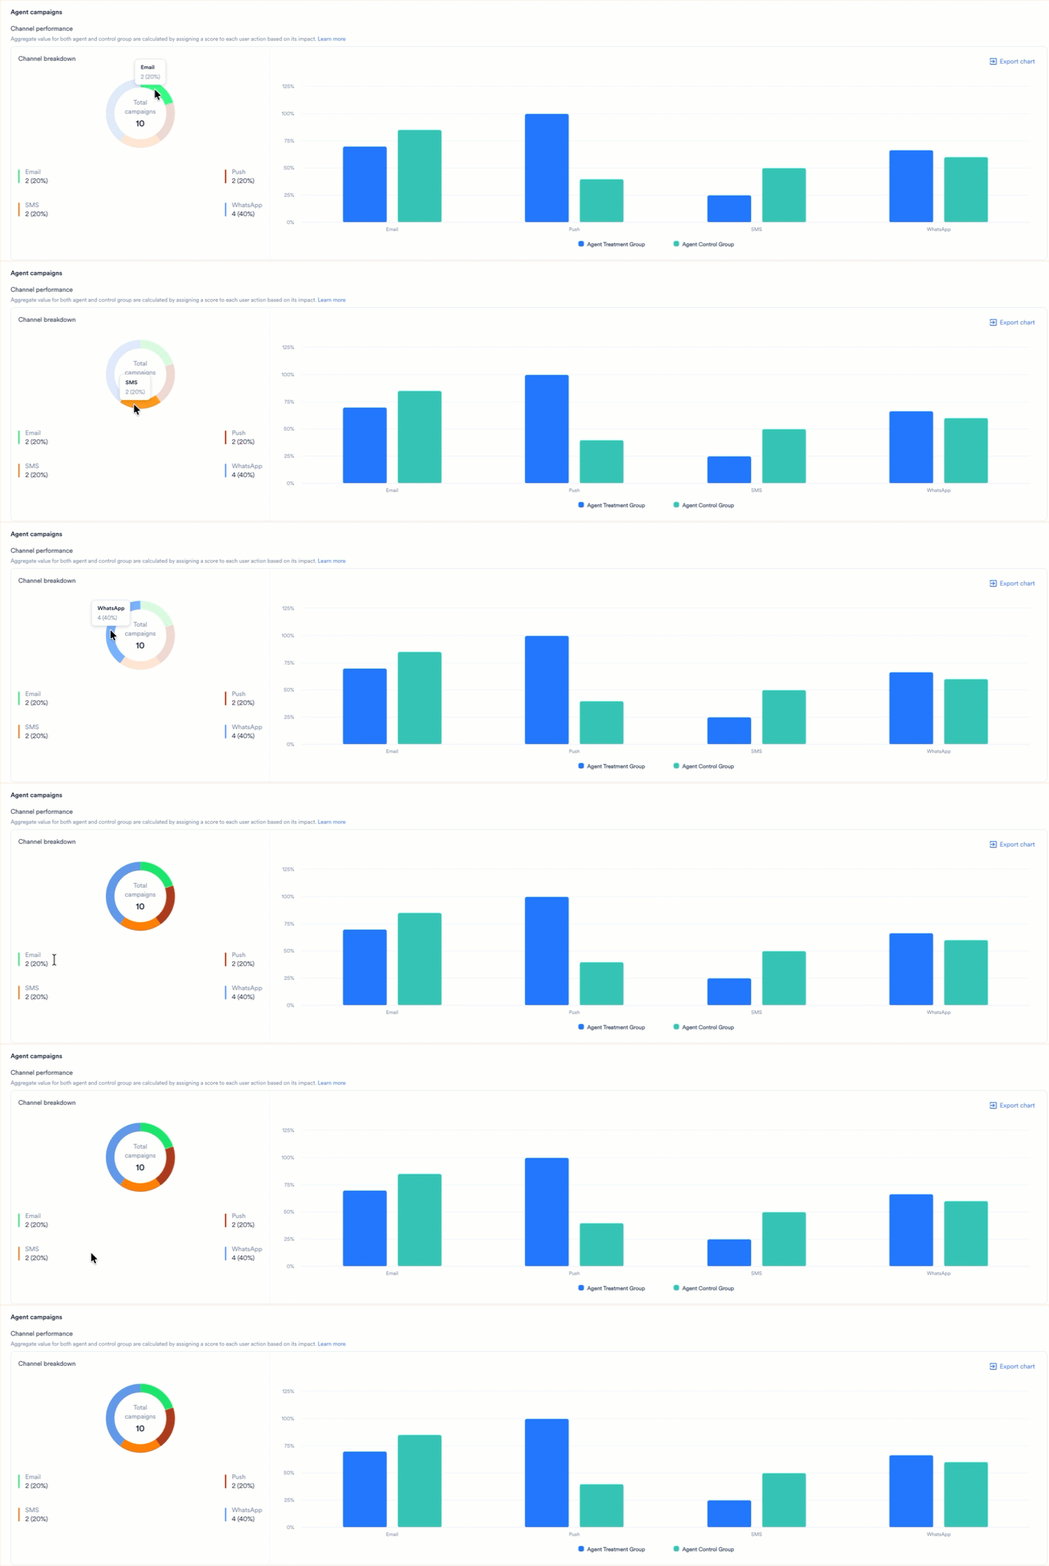
* **Channel Performance**: Use the bar chart to compare **Agent Treatment Group** and **Agent Control Group** performance for each used channel.
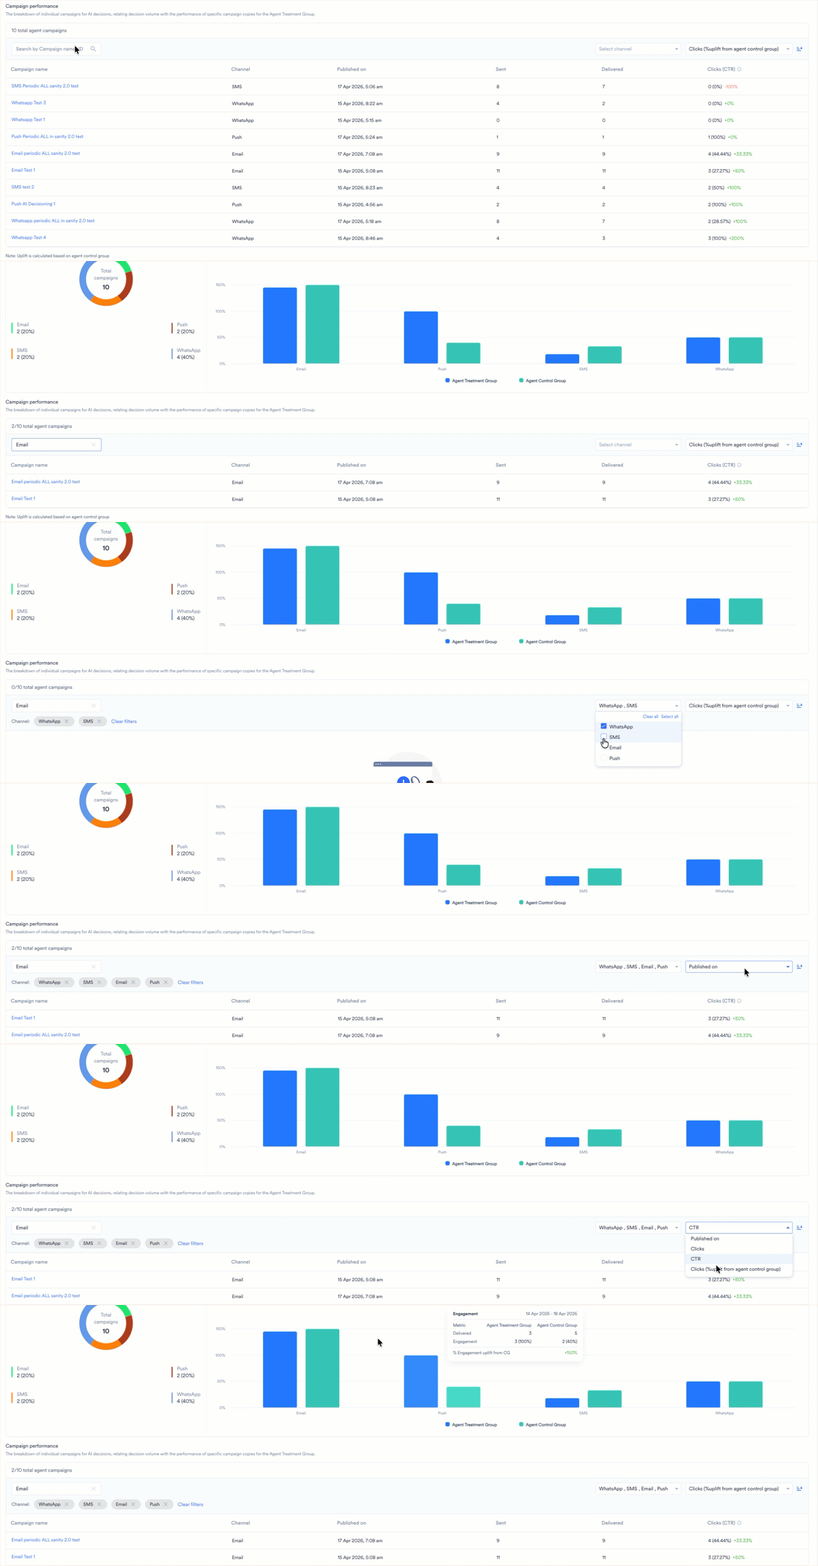
 * **Campaign Performance Table**: A granular list of all campaigns managed for the **Agent Treatment Group**. You can sort this list by **Sent**, **Delivered,** or **CTR** to identify winning variations.
To refine and analyze individual campaign results, perform the following steps:
1. In the **Search by Campaign name, ID** box, type the name or identifier of a specific campaign.
2. In the S**elect channel** list, select one or more channels to filter the table.
3. In the **Published on** list, select a date or timeframe to see campaigns released during that period.
4. Click the sort icon
* **Campaign Performance Table**: A granular list of all campaigns managed for the **Agent Treatment Group**. You can sort this list by **Sent**, **Delivered,** or **CTR** to identify winning variations.
To refine and analyze individual campaign results, perform the following steps:
1. In the **Search by Campaign name, ID** box, type the name or identifier of a specific campaign.
2. In the S**elect channel** list, select one or more channels to filter the table.
3. In the **Published on** list, select a date or timeframe to see campaigns released during that period.
4. Click the sort icon  to organize the list by **Sent**, **Delivered**, or **Clicks** (CTR).
 # Troubleshooting Delivery Statistics
If the **Sent** volume is lower than the number of **Decisions Made**, check the following reasons for delivery failure in the AI funnel:
| Reason (UI) | Explanation |
| :---------------------- | :------------------------------------------------------------------------------------------------------------------------ |
| Agent Inactive | The Agent is paused or inactive during campaign processing. |
| Control Group Exclusion | The user is part of the hold-out baseline group used for uplift measurement. |
| Frequency Limit Reached | The user was skipped due to frequency capping or because the campaign did not rank in the "Top N" most relevant messages. |
| User not eligible | The user does not meet specific segment, platform, or locale requirements at the time of delivery. |
**Warning**
* **Conversion Metrics**: Phase 1 excludes conversion-related data. The Decisioning Agent Analytics UI focuses exclusively on Engagement Uplift.
* **Data Export**: Chart visualizations can be exported only as PNG images. CSV and Excel exports are not currently supported.
# Troubleshooting Delivery Statistics
If the **Sent** volume is lower than the number of **Decisions Made**, check the following reasons for delivery failure in the AI funnel:
| Reason (UI) | Explanation |
| :---------------------- | :------------------------------------------------------------------------------------------------------------------------ |
| Agent Inactive | The Agent is paused or inactive during campaign processing. |
| Control Group Exclusion | The user is part of the hold-out baseline group used for uplift measurement. |
| Frequency Limit Reached | The user was skipped due to frequency capping or because the campaign did not rank in the "Top N" most relevant messages. |
| User not eligible | The user does not meet specific segment, platform, or locale requirements at the time of delivery. |
**Warning**
* **Conversion Metrics**: Phase 1 excludes conversion-related data. The Decisioning Agent Analytics UI focuses exclusively on Engagement Uplift.
* **Data Export**: Chart visualizations can be exported only as PNG images. CSV and Excel exports are not currently supported.