> ## Documentation Index
> Fetch the complete documentation index at: https://moengage.com/docs/llms.txt
> Use this file to discover all available pages before exploring further.
# Overview
> Explore MoEngage analysis types — Behavior, Funnel, Retention, Session and Source, User Paths, and more for data-driven engagement strategies.
MoEngage provides various analysis types suited for different scenarios to evaluate product performance and user interactions with your platform. By utilizing these analysis options, you can implement data-driven customer engagement strategies. The available analysis options include:
* [Users](/docs/user-guide/analyze/analytics/users)
* [Behavior](/docs/user-guide/analyze/analytics/behavior)
* [Funnel](/docs/user-guide/analyze/analytics/funnels)
* [Retention](/docs/user-guide/analyze/analytics/retention)
* [Session and source](/docs/user-guide/analyze/analytics/session-and-source)
* [User paths](/docs/user-guide/analyze/analytics/user-paths)
* [Acquisition](/docs/user-guide/analyze/analytics/acquisition)
* [Uninstalls](/docs/user-guide/analyze/analytics/uninstall)
These tools will help you gather and analyze demographics, preferences, user interactions across various channels, conversion rates, and retention patterns. They will allow you to identify key trends and gain deeper insights into your customer and product needs.
# Getting Started
At a high level, you will follow these standard steps to perform these analyses. While the specifics may vary based on the case and needs, this provides a general overview of the process to be followed.
## Choose Events
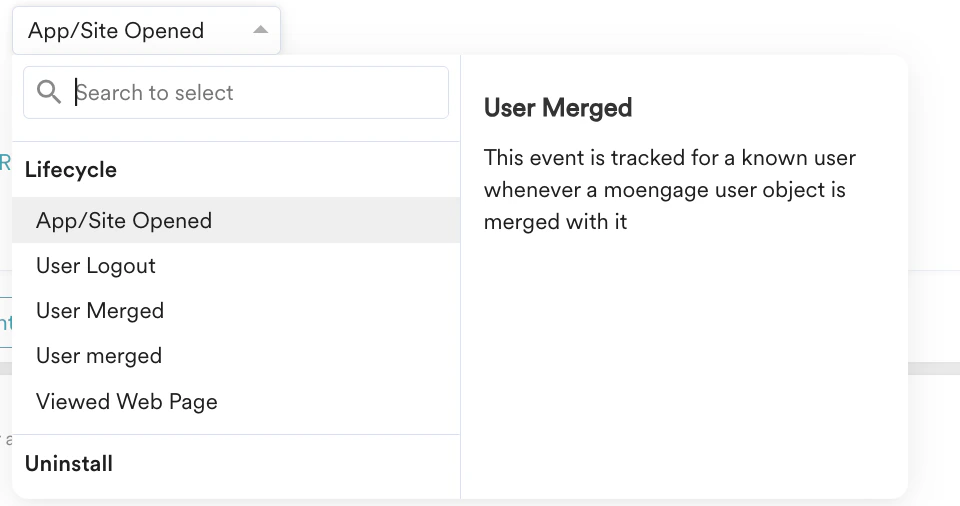
Select the events or properties for the analysis, either single or multiple. Choose those that will provide the most value for your analysis. These should generally be relevant to your users and app/website.
 ## Define Attributes
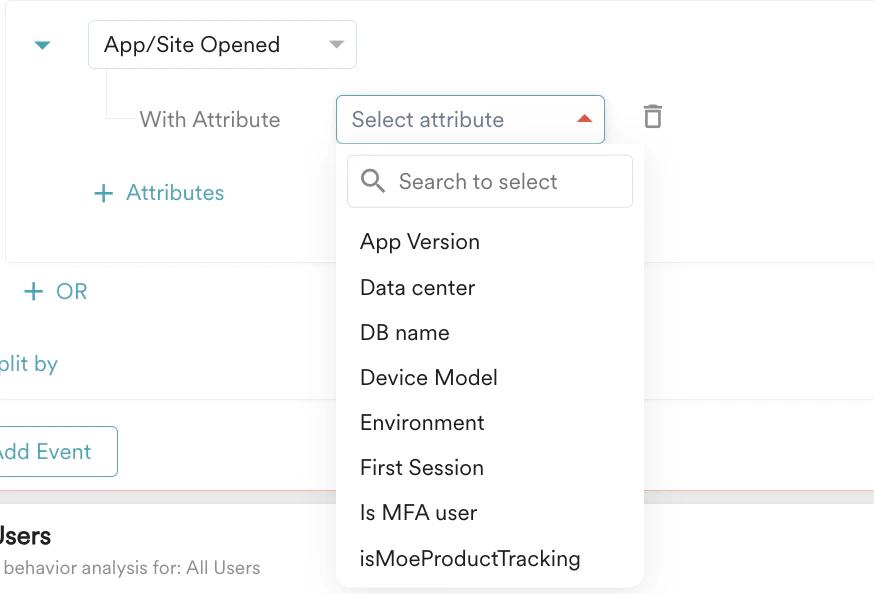
Select relevant attributes for your event. Attributes provide context for the events you choose, allowing you to filter specific actions or events further.
## Define Attributes
Select relevant attributes for your event. Attributes provide context for the events you choose, allowing you to filter specific actions or events further.
 ## Choose Users
Identify the users on whom you want to perform this analysis. These are the individuals who have completed the set of events that you have selected. For more information, refer to [Segmentation](/docs/user-guide/segment/segment-operations/rule-based-filter-segments).
## Choose Users
Identify the users on whom you want to perform this analysis. These are the individuals who have completed the set of events that you have selected. For more information, refer to [Segmentation](/docs/user-guide/segment/segment-operations/rule-based-filter-segments).
 ## Analysis Options and Duration
MoEngage offers options for count-level and aggregated analysis. These options vary depending on the type of analysis. You will learn more about these options in the analysis types.
After selecting the analysis option, you will specify the duration for which you wish to run the analysis.
## Charts
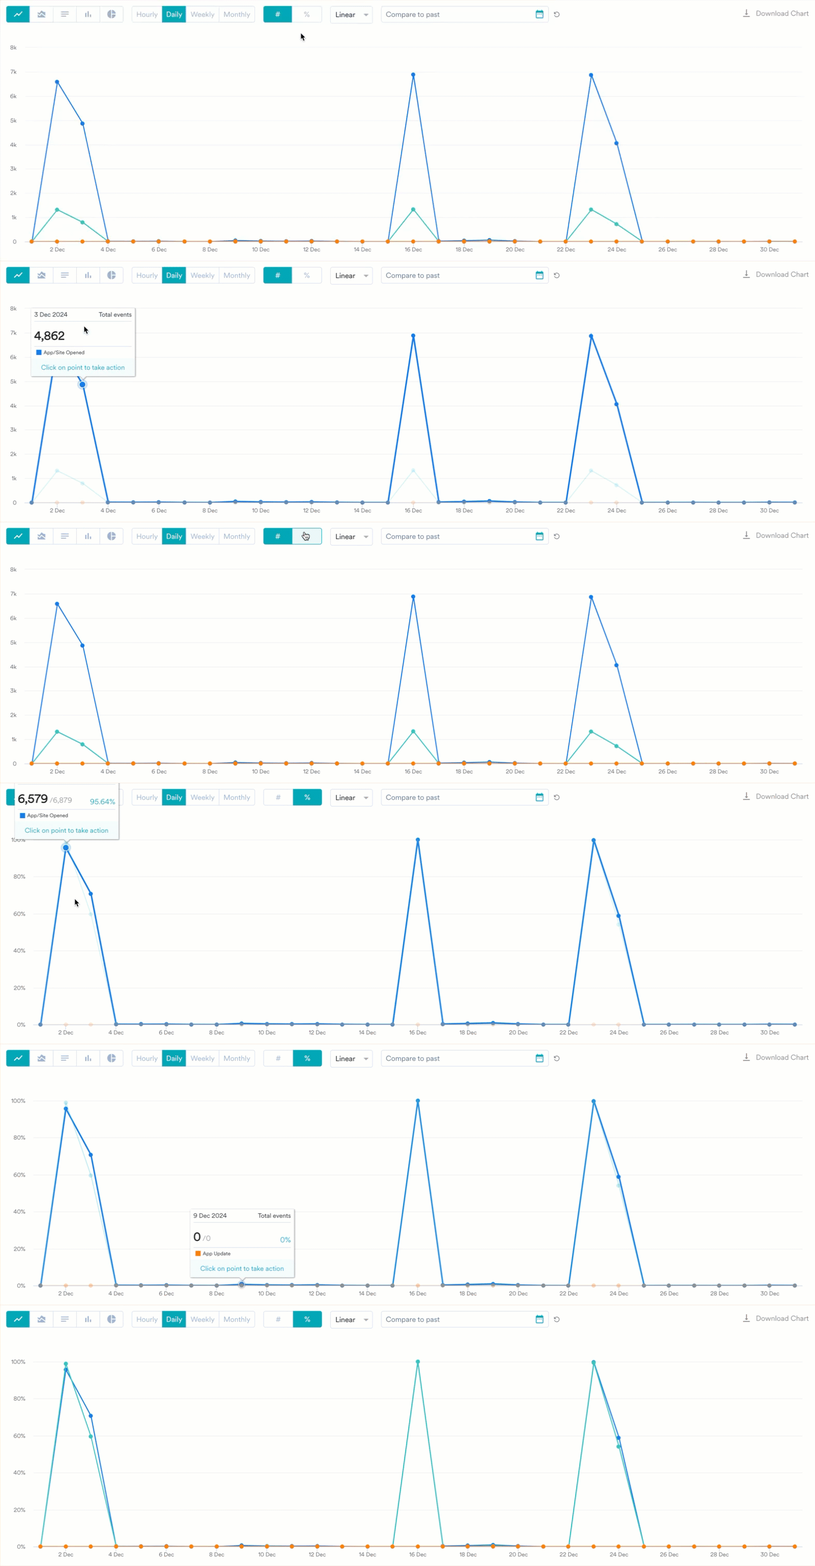
Charts are the results obtained at the end of an analysis. They visually represent data, making it easier to understand large quantities and their relationships with different data. Each analysis type offers different ways to visualize your query. To give you a general overview, the types of visualization options available are:
* Line
* Bar
* Column
* Area
* Pie
* Choropleth
You can visualize the results in Numerical and Percentage views.
## Analysis Options and Duration
MoEngage offers options for count-level and aggregated analysis. These options vary depending on the type of analysis. You will learn more about these options in the analysis types.
After selecting the analysis option, you will specify the duration for which you wish to run the analysis.
## Charts
Charts are the results obtained at the end of an analysis. They visually represent data, making it easier to understand large quantities and their relationships with different data. Each analysis type offers different ways to visualize your query. To give you a general overview, the types of visualization options available are:
* Line
* Bar
* Column
* Area
* Pie
* Choropleth
You can visualize the results in Numerical and Percentage views.
 ## Tables
With charts, the data is also presented in tabular form, arranged in rows and columns. Tables are useful for locating specific information and identifying patterns.
You can adjust how each table looks and what it shows—resize and reorder columns, sort and filter values, pin the columns you care about, and download the current view—without rerunning your query. These table controls are available across Behavior, Funnels, Retention, Session & Source, User Analysis, and Custom Dashboards.
Sorting, filtering, and other column actions only change how the table is displayed. They do not change the underlying query or the chart above the table.
### Transpose Table
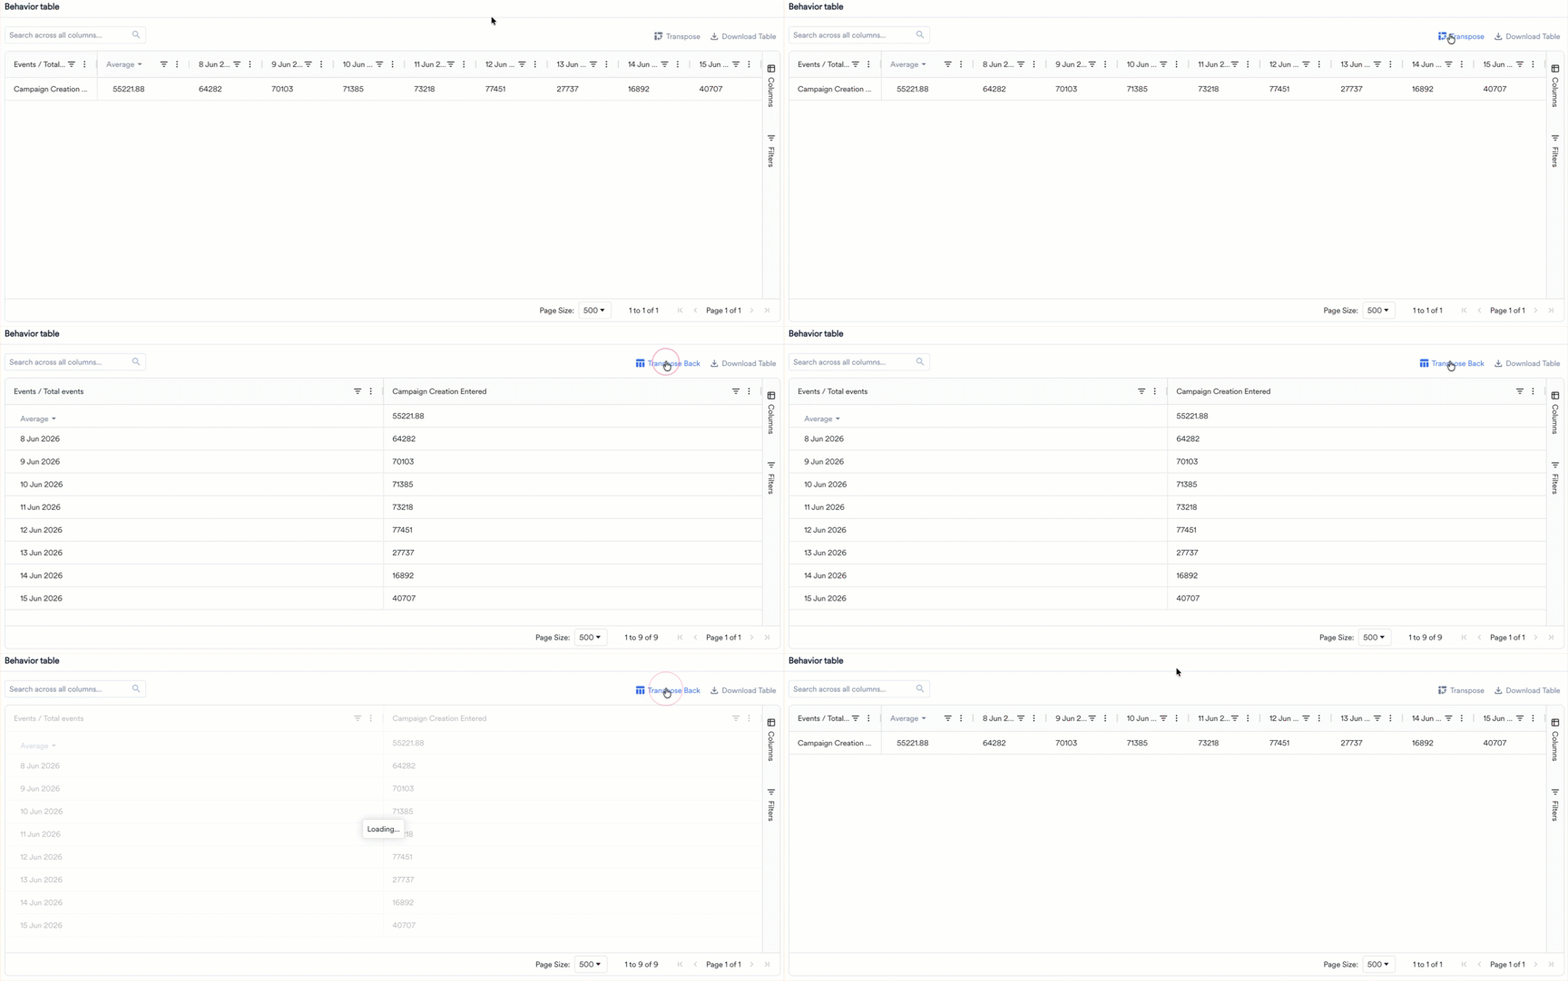
You can transpose the table. This allows you to view and download the table in your preferred format by shifting its vertical and horizontal orientation.
## Tables
With charts, the data is also presented in tabular form, arranged in rows and columns. Tables are useful for locating specific information and identifying patterns.
You can adjust how each table looks and what it shows—resize and reorder columns, sort and filter values, pin the columns you care about, and download the current view—without rerunning your query. These table controls are available across Behavior, Funnels, Retention, Session & Source, User Analysis, and Custom Dashboards.
Sorting, filtering, and other column actions only change how the table is displayed. They do not change the underlying query or the chart above the table.
### Transpose Table
You can transpose the table. This allows you to view and download the table in your preferred format by shifting its vertical and horizontal orientation.
 ### Sorting and Calculation
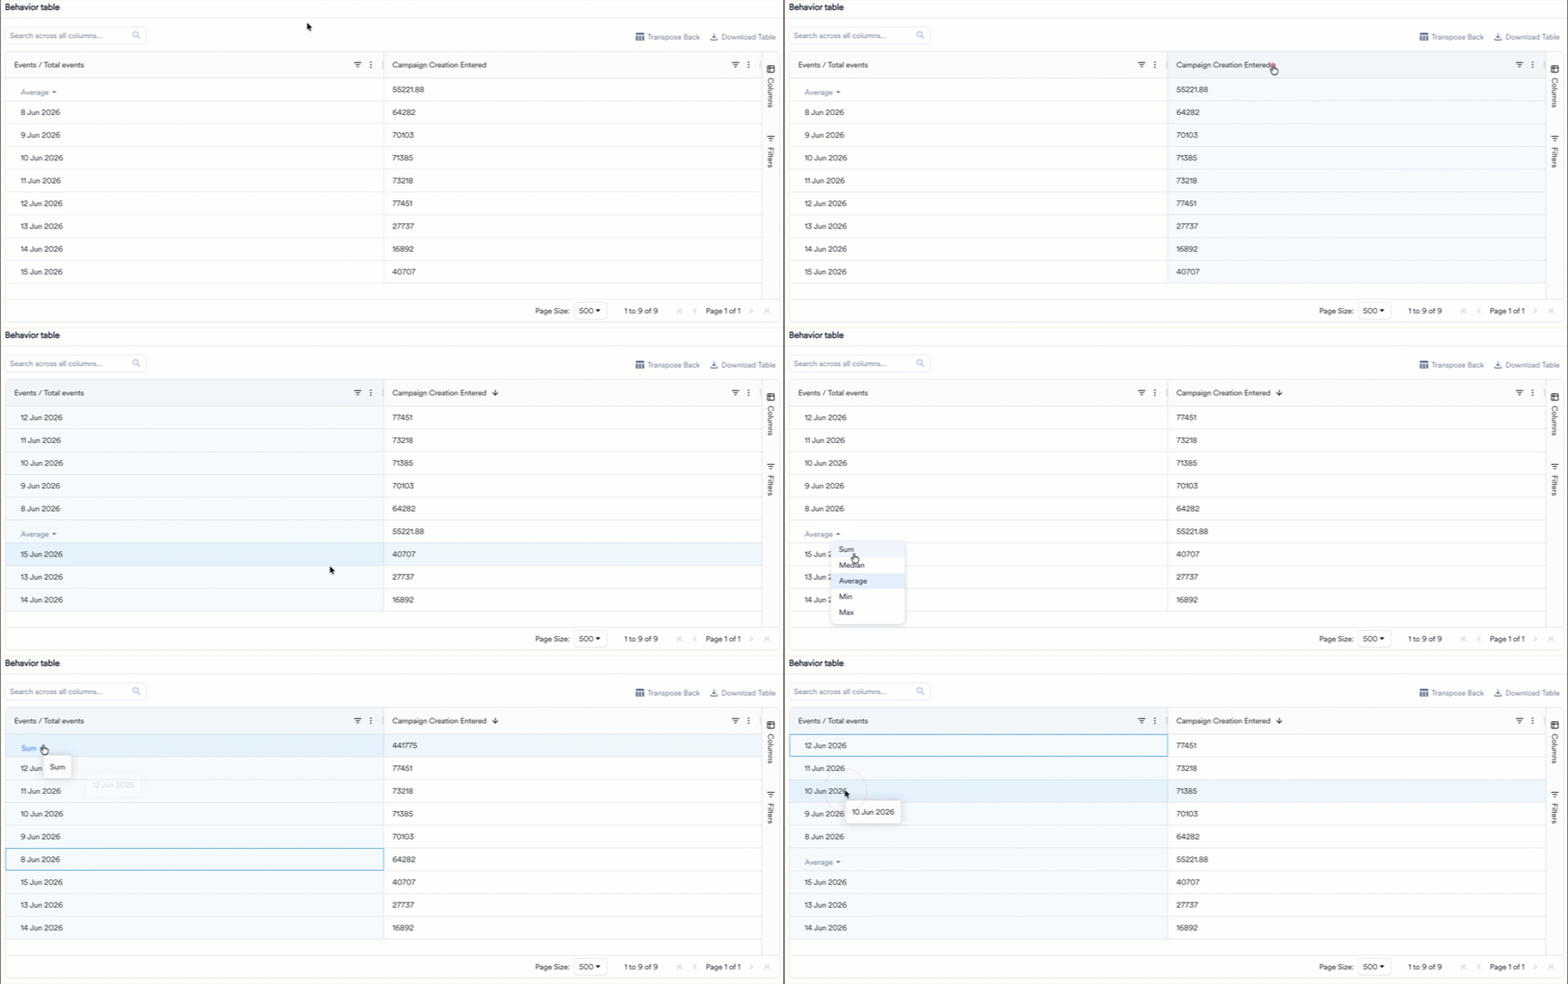
You can organize the data in the table without external tools. Click the header of any column to sort the table data. Sorting is available on every column.
* The first click sorts in ascending order, the second click sorts in descending order, and the third click resets the column to its default order.
* To sort by more than one column, hold **Shift** and click additional column headers. The table applies the sorts in the order you click them.
* You can also open the column menu (the three-dot icon in the column header) and select **Sort Ascending** or **Sort Descending**.
Along with sorting, you can choose the calculation type from the list in the column.
* Sum
* Median
* Average
* Min
* Max
For tables with multiple events, you can sort the calculation by clicking the header of the calculation type. This will sort the data in ascending or descending order. In the transpose view, the calculation type row remains fixed while the columns are sortable.
### Sorting and Calculation
You can organize the data in the table without external tools. Click the header of any column to sort the table data. Sorting is available on every column.
* The first click sorts in ascending order, the second click sorts in descending order, and the third click resets the column to its default order.
* To sort by more than one column, hold **Shift** and click additional column headers. The table applies the sorts in the order you click them.
* You can also open the column menu (the three-dot icon in the column header) and select **Sort Ascending** or **Sort Descending**.
Along with sorting, you can choose the calculation type from the list in the column.
* Sum
* Median
* Average
* Min
* Max
For tables with multiple events, you can sort the calculation by clicking the header of the calculation type. This will sort the data in ascending or descending order. In the transpose view, the calculation type row remains fixed while the columns are sortable.
 ### Resize Columns
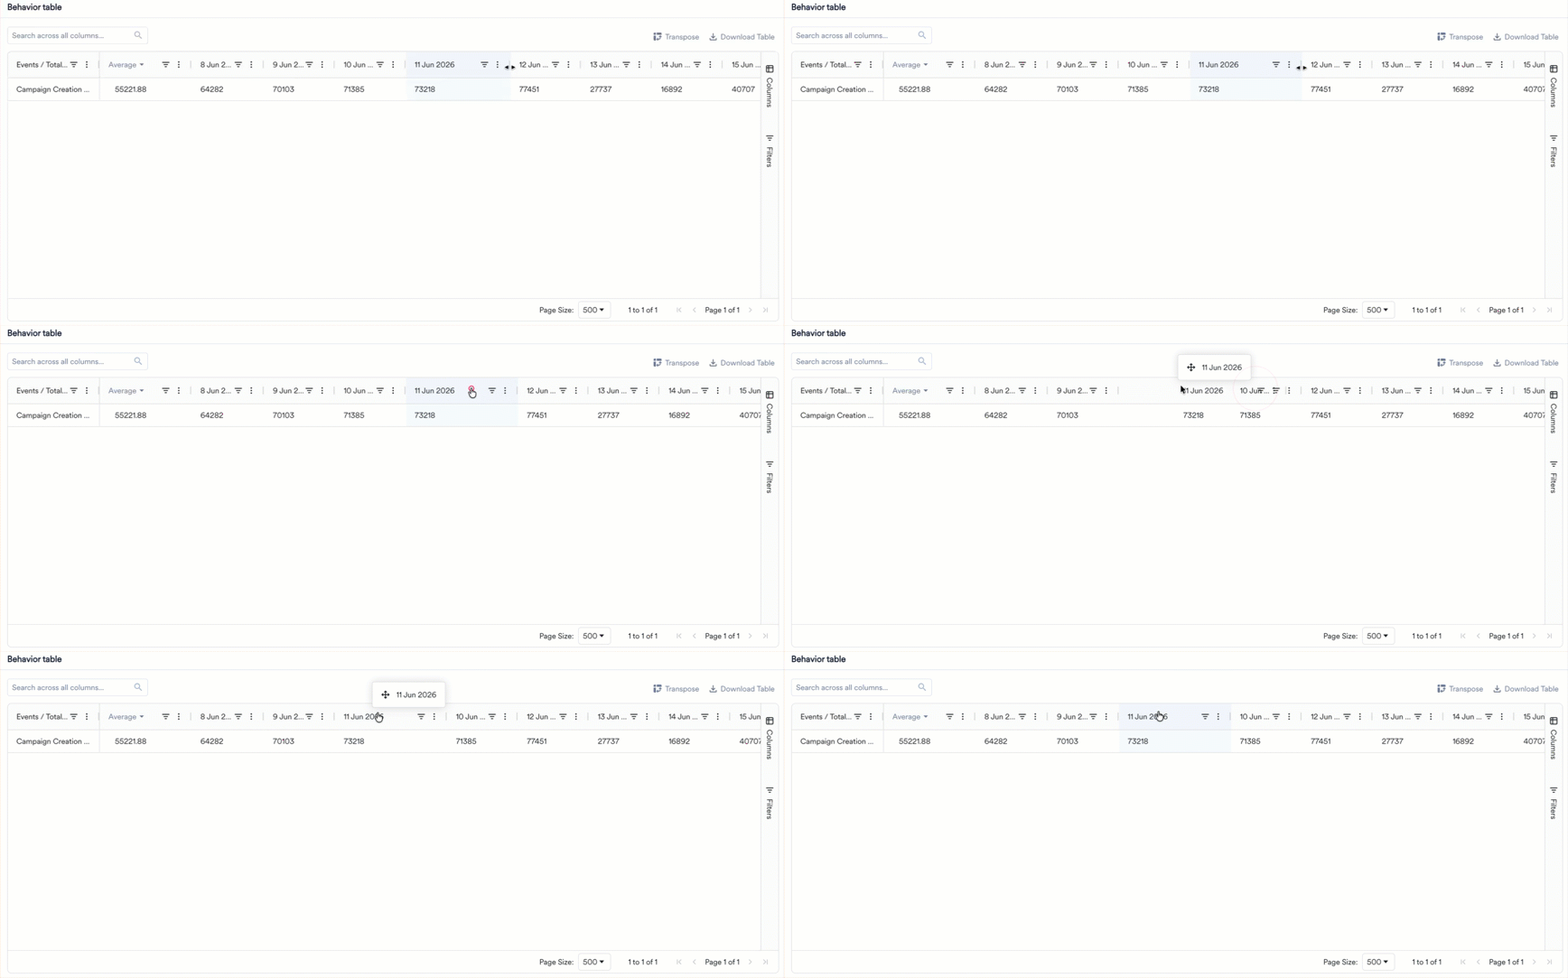
Drag the divider between two column headers to make a column wider or narrower. Each column has a minimum and maximum width, so content stays readable. To fit a column to its content automatically, open the column menu (the three-dot icon in the column header) and select **Autosize This Column** or **Autosize All Columns**. When you resize the browser window, the table adjusts to fit the available space.
### Resize Columns
Drag the divider between two column headers to make a column wider or narrower. Each column has a minimum and maximum width, so content stays readable. To fit a column to its content automatically, open the column menu (the three-dot icon in the column header) and select **Autosize This Column** or **Autosize All Columns**. When you resize the browser window, the table adjusts to fit the available space.
 ### Filter
You can narrow the rows shown in a table without changing your query.
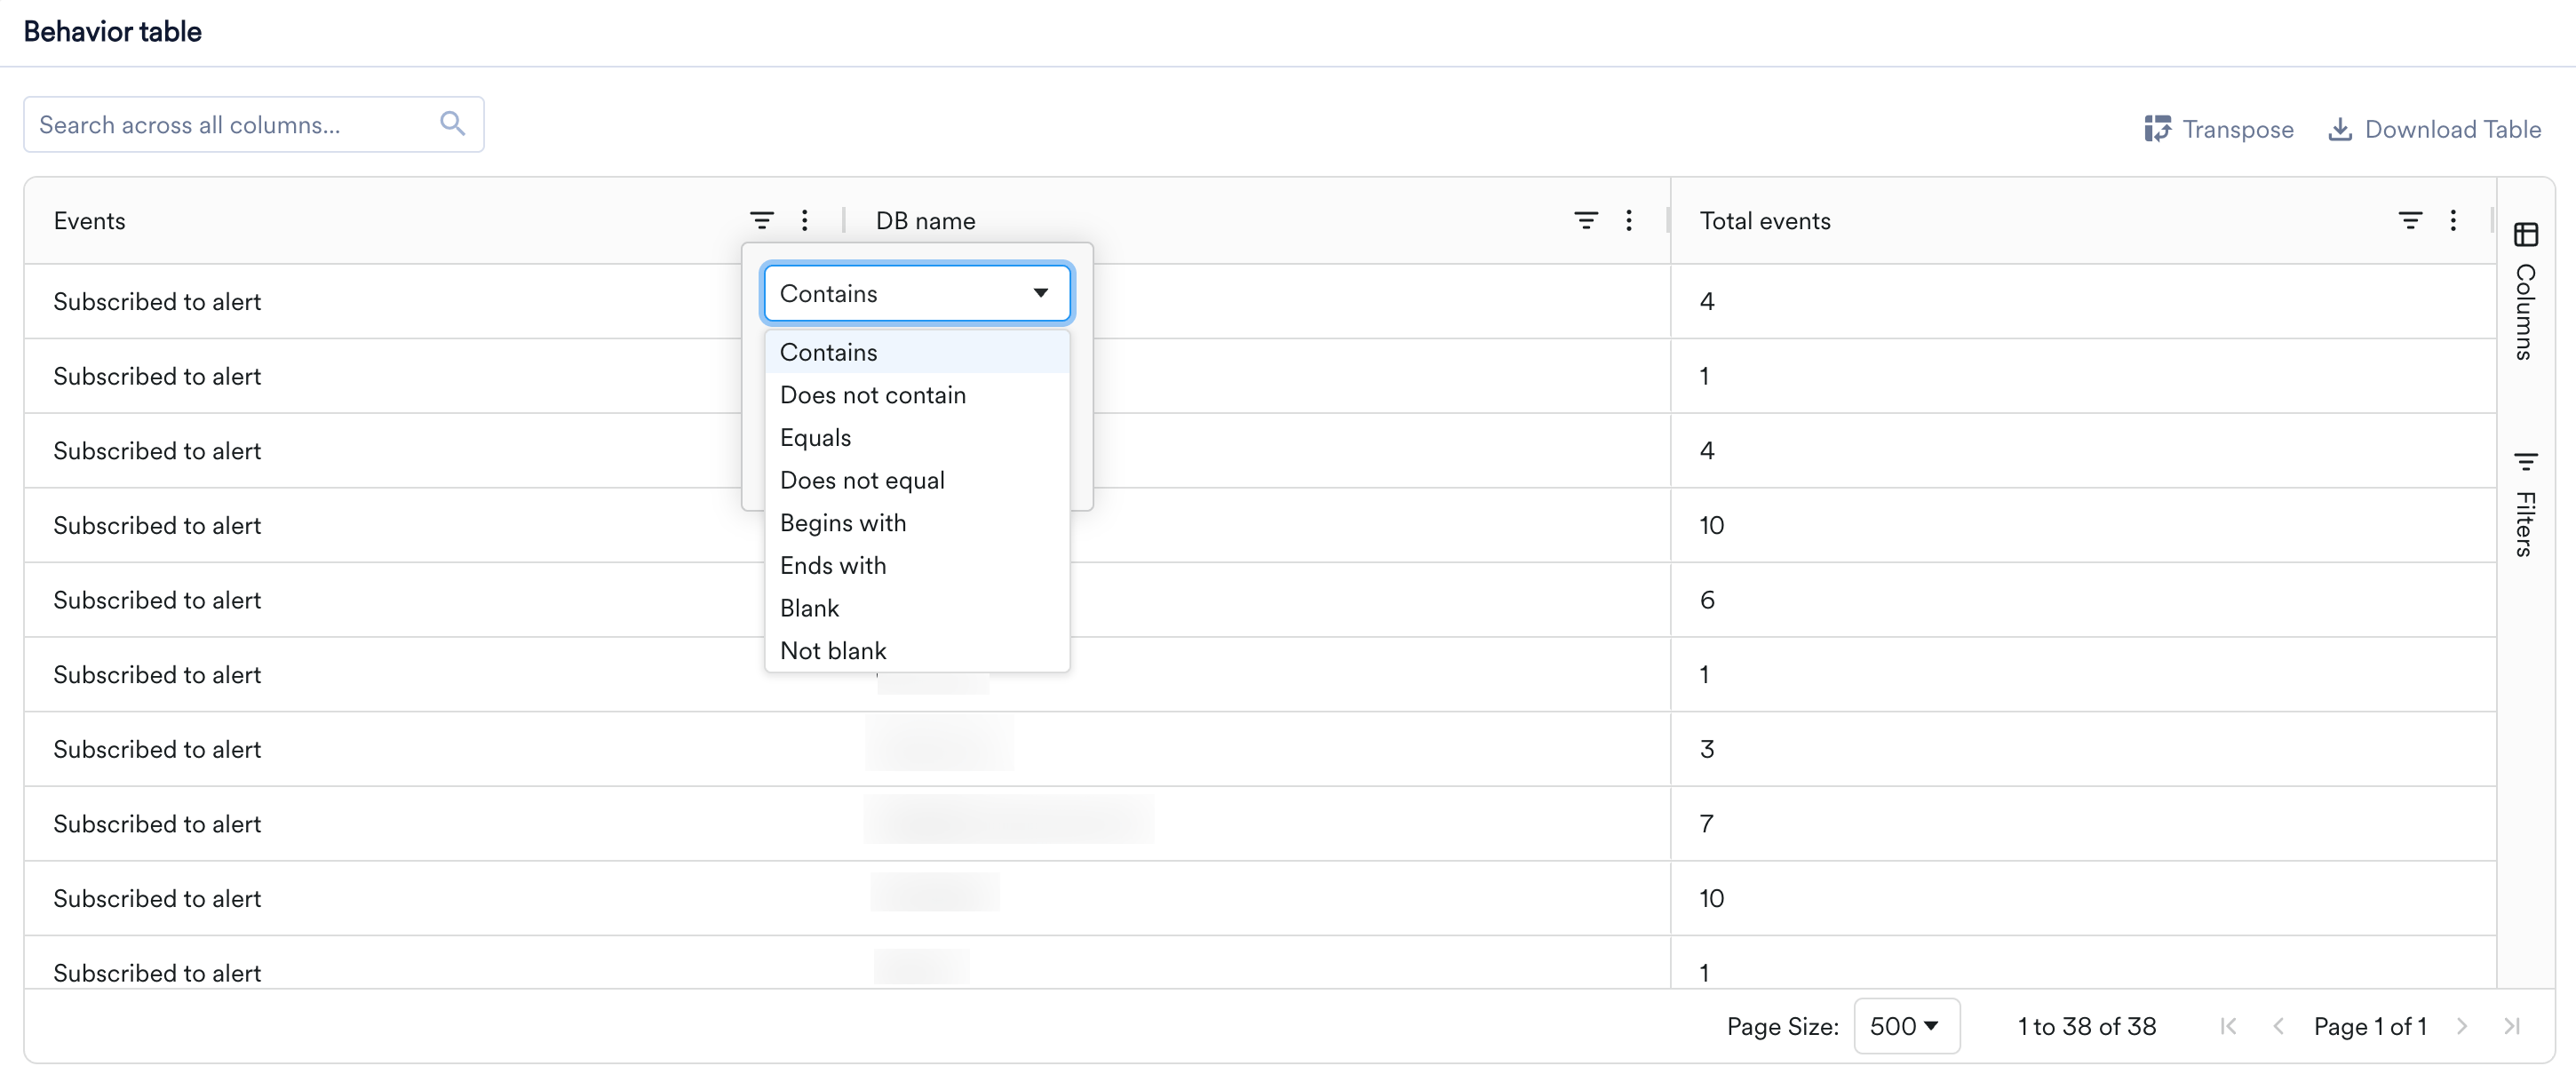
* **Column filters:** Click the filter (funnel) icon in a column header to keep only the rows that match a condition. For text columns, the available operators are **Contains**, **Does not contain**, **Equals**, **Does not equal**, **Begins with**, **Ends with**, **Blank**, and **Not blank**. You can combine two conditions with **AND** or **OR**, and apply filters on more than one column at the same time.
* **Quick search:** Use the **Search across all columns** box above the table to find a value across all rows and columns at once. The table updates as you type to show only matching rows.
* **Advanced filters:** For more complex conditions, open the **Filters** tab on the right sidebar to assemble multiple conditions into a single filter expression.
### Filter
You can narrow the rows shown in a table without changing your query.
* **Column filters:** Click the filter (funnel) icon in a column header to keep only the rows that match a condition. For text columns, the available operators are **Contains**, **Does not contain**, **Equals**, **Does not equal**, **Begins with**, **Ends with**, **Blank**, and **Not blank**. You can combine two conditions with **AND** or **OR**, and apply filters on more than one column at the same time.
* **Quick search:** Use the **Search across all columns** box above the table to find a value across all rows and columns at once. The table updates as you type to show only matching rows.
* **Advanced filters:** For more complex conditions, open the **Filters** tab on the right sidebar to assemble multiple conditions into a single filter expression.
 ### Pin, Reorder, and Choose Columns
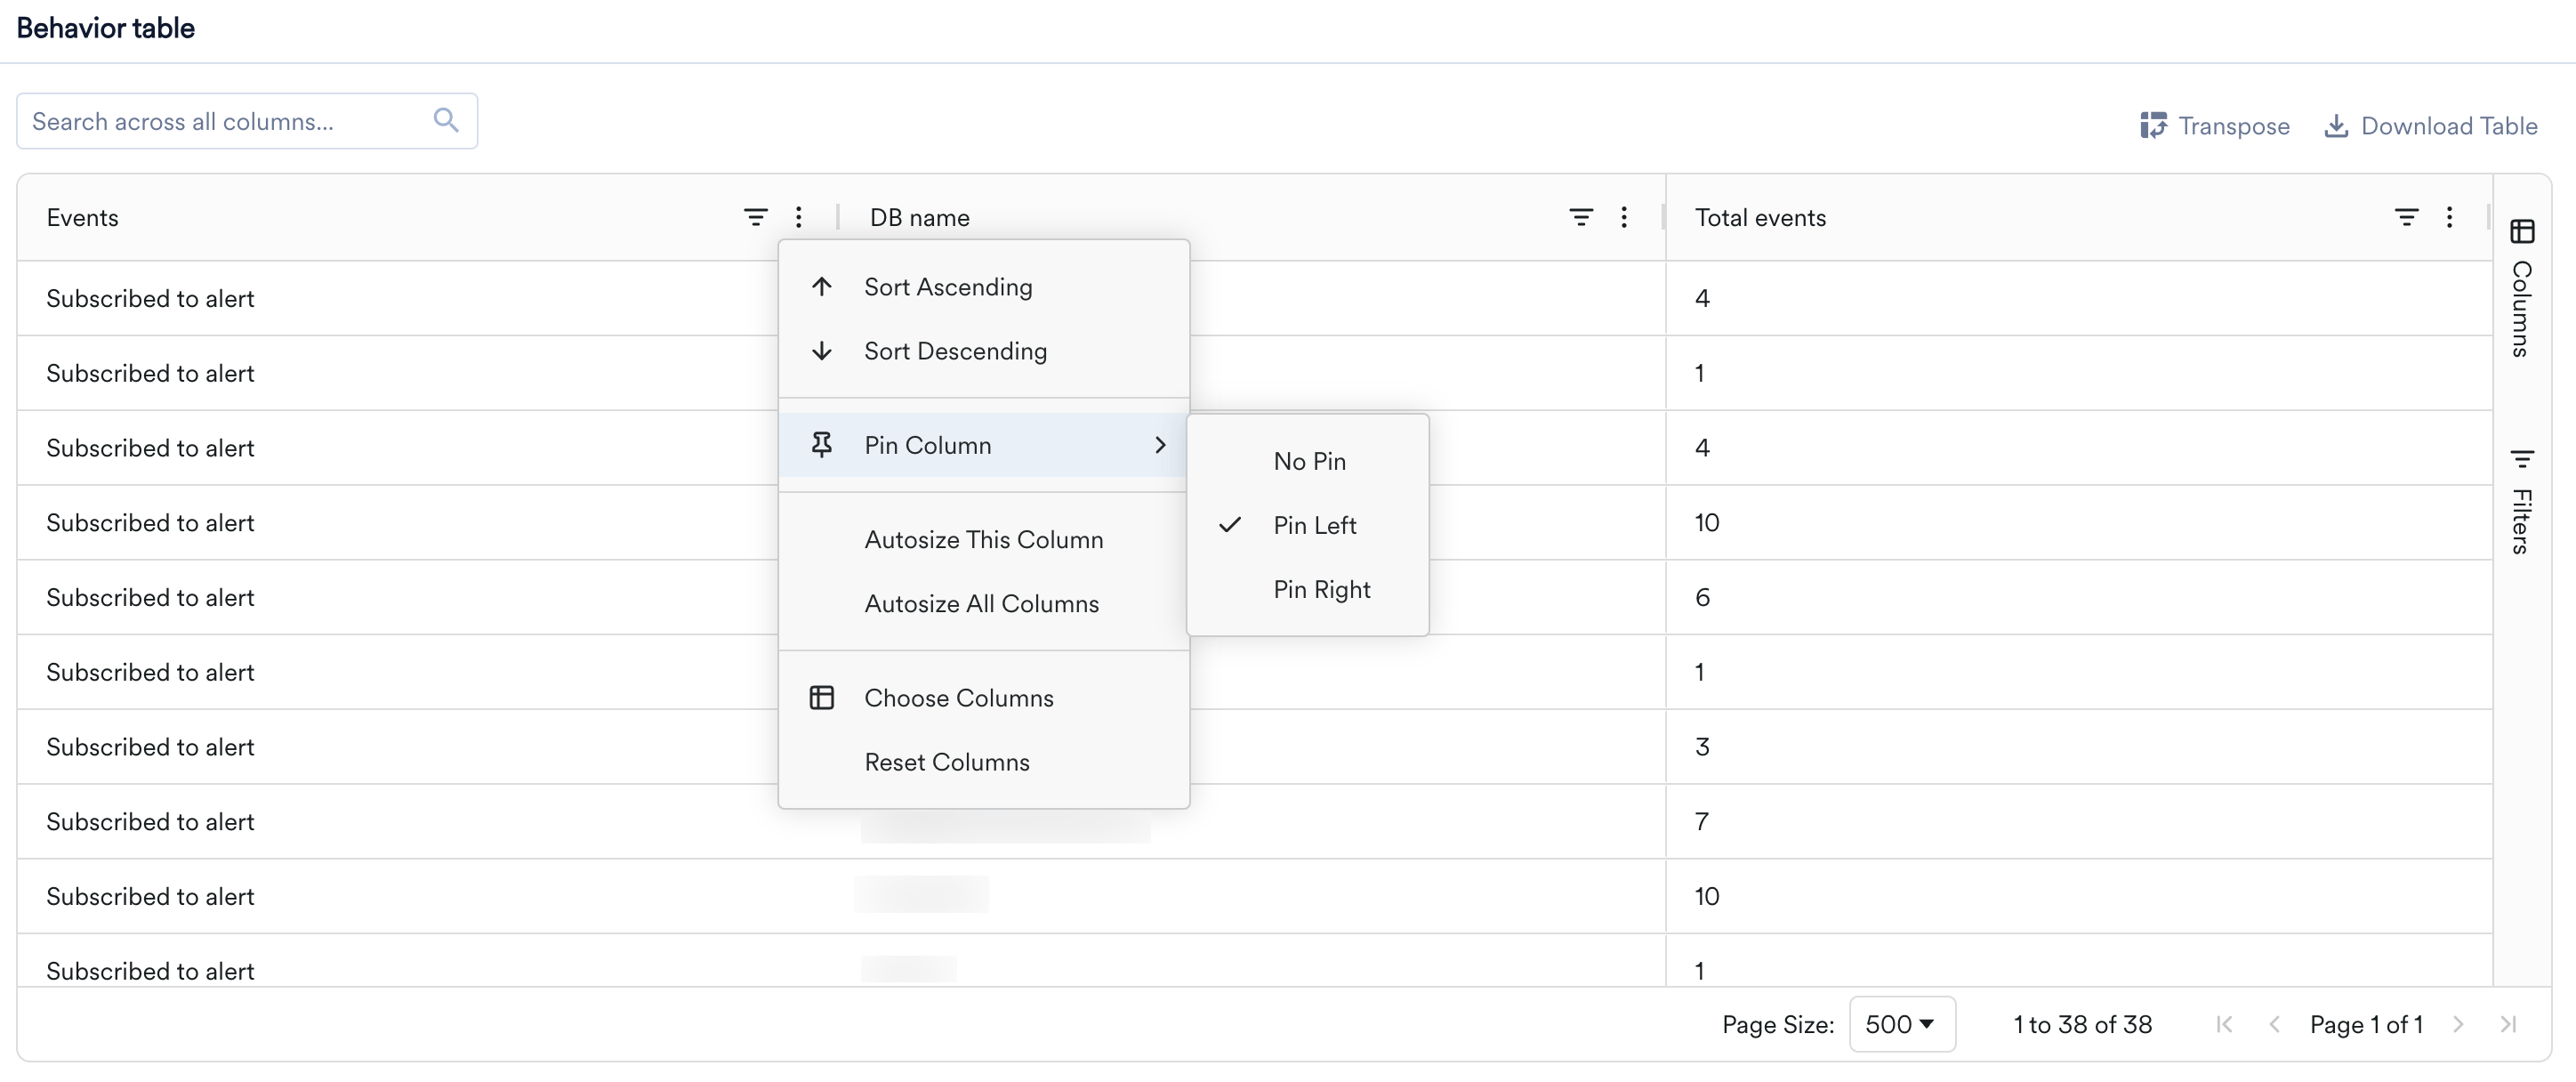
* **Pin:** To keep a column visible while you scroll horizontally, open the column menu (the three-dot icon in the column header), select **Pin Column**, and choose **Pin Left** or **Pin Right**. Select **No Pin** to unpin. You can also drag a column into or out of a pinned section.
* **Reorder:** Drag a column header left or right to change the order of columns.
* **Choose columns:** Open the column menu and select **Choose Columns** to show or hide columns, or use the **Columns** tab on the right sidebar. Select **Reset Columns** to restore the default layout.
### Pin, Reorder, and Choose Columns
* **Pin:** To keep a column visible while you scroll horizontally, open the column menu (the three-dot icon in the column header), select **Pin Column**, and choose **Pin Left** or **Pin Right**. Select **No Pin** to unpin. You can also drag a column into or out of a pinned section.
* **Reorder:** Drag a column header left or right to change the order of columns.
* **Choose columns:** Open the column menu and select **Choose Columns** to show or hide columns, or use the **Columns** tab on the right sidebar. Select **Reset Columns** to restore the default layout.
 ### Download the Table
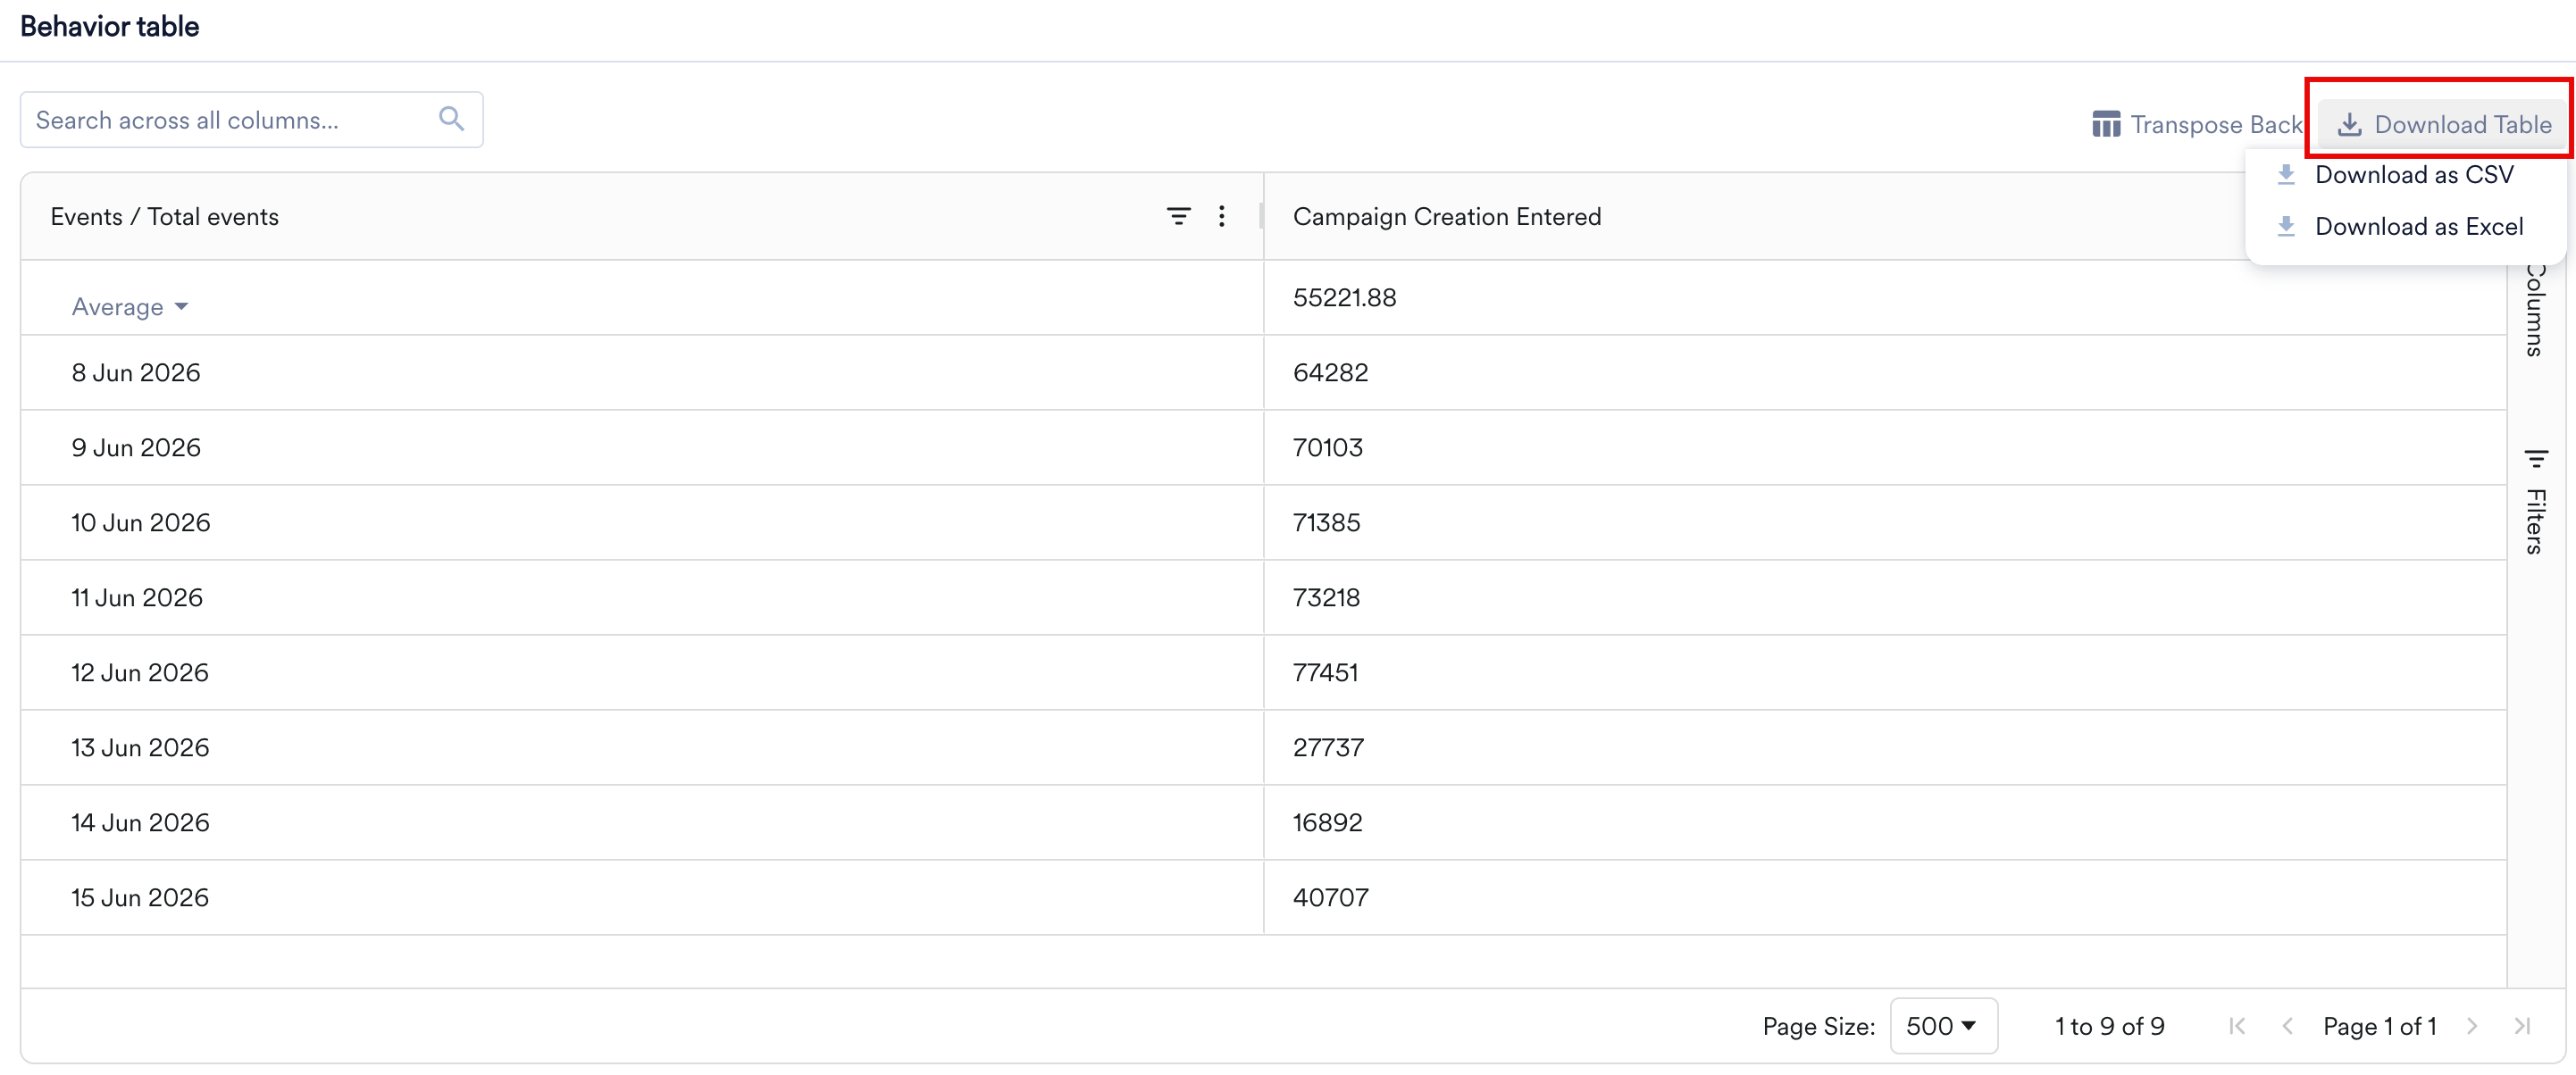
To share or analyze the table elsewhere, click **Download Table** at the top of the table and choose **Download as CSV** or **Download as Excel**. The download reflects the table's current state, including any filters you applied and the sort order you set, and includes all columns.
### Download the Table
To share or analyze the table elsewhere, click **Download Table** at the top of the table and choose **Download as CSV** or **Download as Excel**. The download reflects the table's current state, including any filters you applied and the sort order you set, and includes all columns.
 ### Tooltips and Copy
When a cell value or column header is too long to fit, the full text appears in a tooltip when you hover over it. Values that already fit do not show a tooltip. You can also select one or more cells and copy them to your clipboard—the copied text keeps the order in which you selected the cells.
### Pagination and Infinite Scroll
How a table loads rows depends on where you view it. On the analysis pages (Behavior, Funnels, Retention, Session & Source, and User Analysis), tables are paginated: a **Page Size** selector controls how many rows appear per page, a row count shows the current range (for example, 1 to 38 of 38), and page controls let you move between pages. On Custom Dashboards, tables use infinite scroll, loading more rows as you scroll down.
# Next Steps
* [MoEngage Dashboards](/docs/user-guide/analyze/dashboards/overview)
* [Behavior Analysis](/docs/user-guide/analyze/analytics/behavior/behavior-analysis)
### Tooltips and Copy
When a cell value or column header is too long to fit, the full text appears in a tooltip when you hover over it. Values that already fit do not show a tooltip. You can also select one or more cells and copy them to your clipboard—the copied text keeps the order in which you selected the cells.
### Pagination and Infinite Scroll
How a table loads rows depends on where you view it. On the analysis pages (Behavior, Funnels, Retention, Session & Source, and User Analysis), tables are paginated: a **Page Size** selector controls how many rows appear per page, a row count shows the current range (for example, 1 to 38 of 38), and page controls let you move between pages. On Custom Dashboards, tables use infinite scroll, loading more rows as you scroll down.
# Next Steps
* [MoEngage Dashboards](/docs/user-guide/analyze/dashboards/overview)
* [Behavior Analysis](/docs/user-guide/analyze/analytics/behavior/behavior-analysis)