> ## Documentation Index
> Fetch the complete documentation index at: https://moengage.com/docs/llms.txt
> Use this file to discover all available pages before exploring further.
# How to Analyze OTT Content Performance
# Introduction
For a media or entertainment brand, comparing time-series data for different contents helps marketers identify which shows, movies, or episodes are performing well in terms of viewership, engagement, and retention. Analyzing viewing trends over time can highlight popular genres, themes, and formats, assisting in making content acquisition and production decisions.
In this article, we will understand how you can analyse different content viewership on your app or site in terms of engagement and retention.
# Expected Result
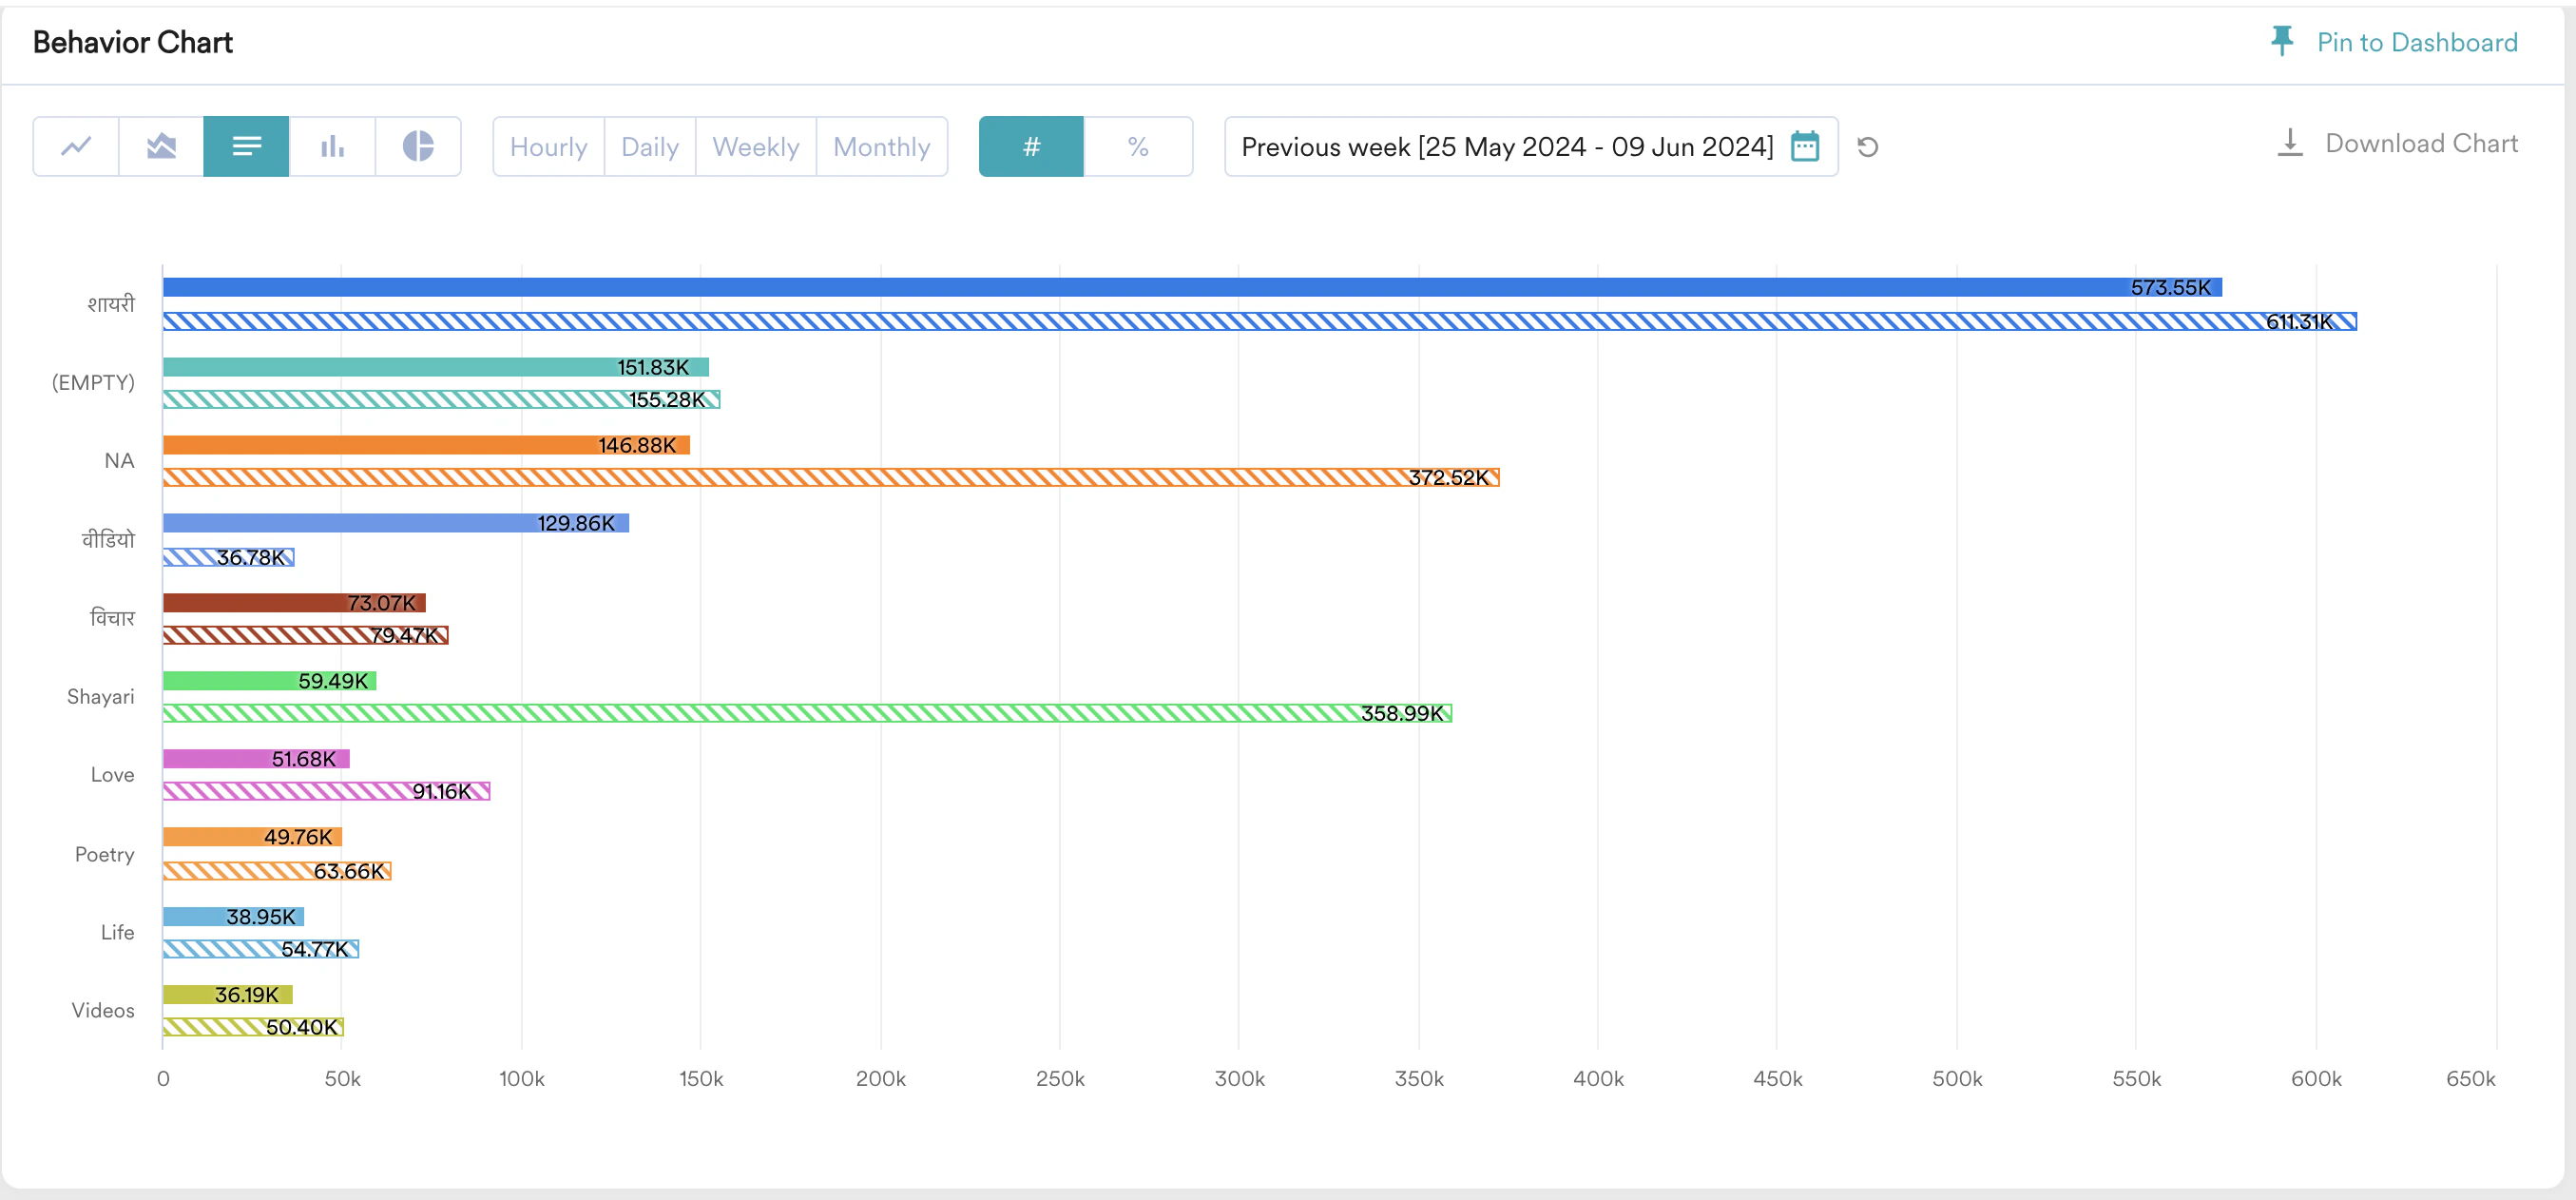
Marketers will be able to see time series comparison of video viewership on their app or site:
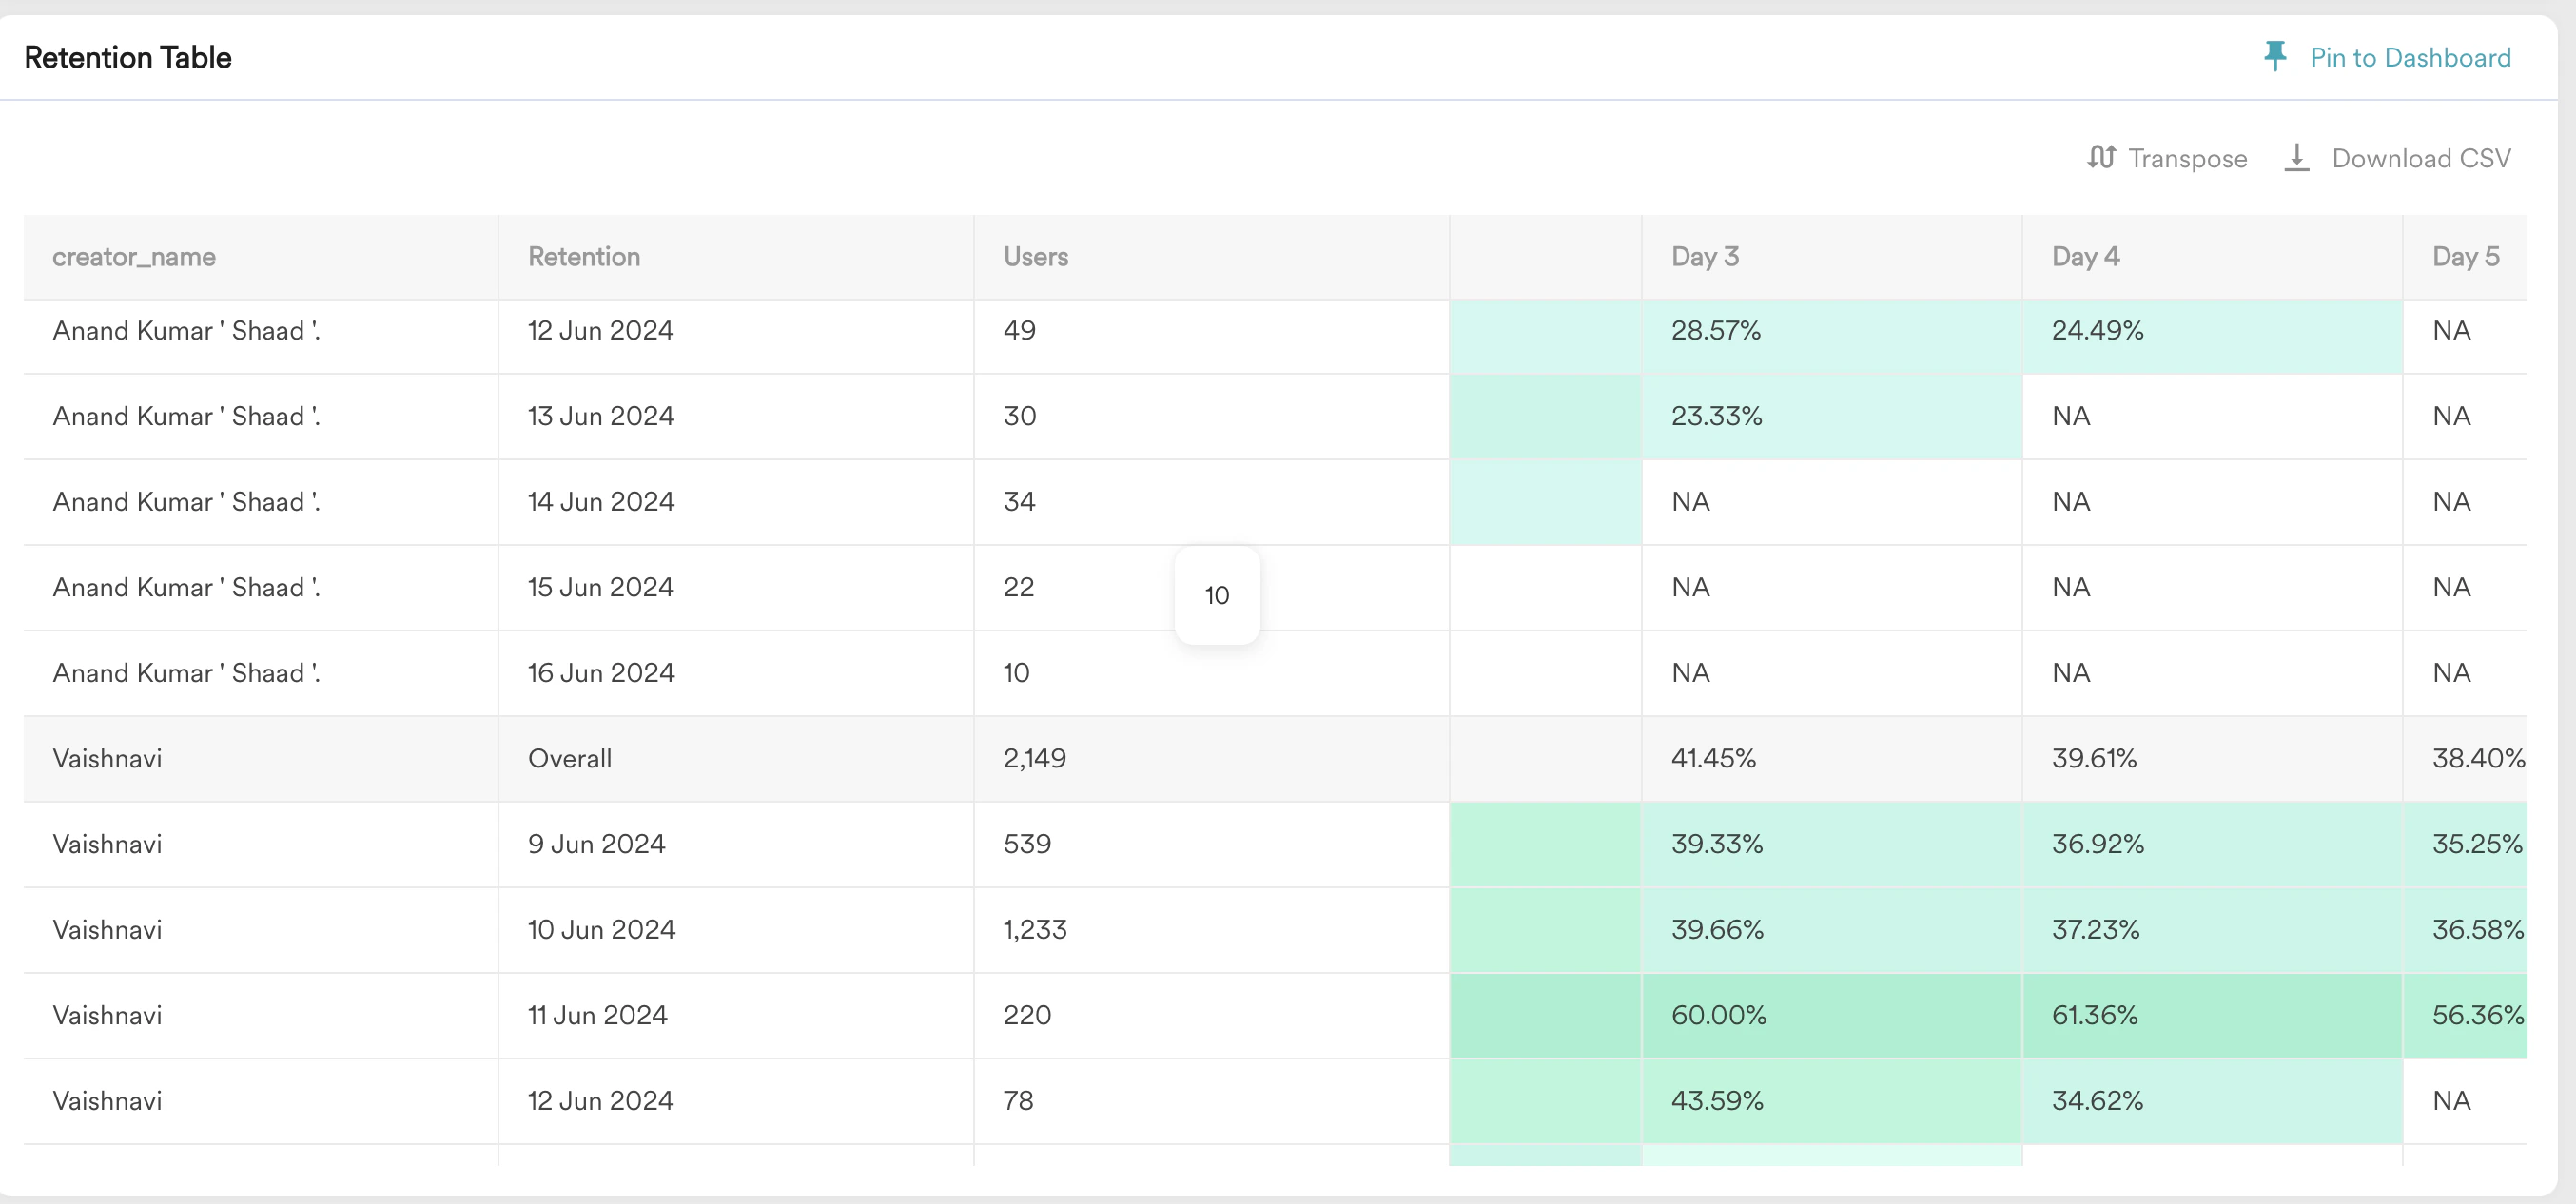
 Marketers will be able to identify retention rates across videos based on content creators:
 * Analyze product needs to be enabled.
* Events such as video\_watched with video\_categories attribute must be present.
# Analyze Content Performance
In this section, let us analyze the content performance.
## Compare Based on Engagement, Popularity, and Viewership
1. Navigate to **Analyze** > **Behaviour** on your MoEngage Dashboard.
* Analyze product needs to be enabled.
* Events such as video\_watched with video\_categories attribute must be present.
# Analyze Content Performance
In this section, let us analyze the content performance.
## Compare Based on Engagement, Popularity, and Viewership
1. Navigate to **Analyze** > **Behaviour** on your MoEngage Dashboard.
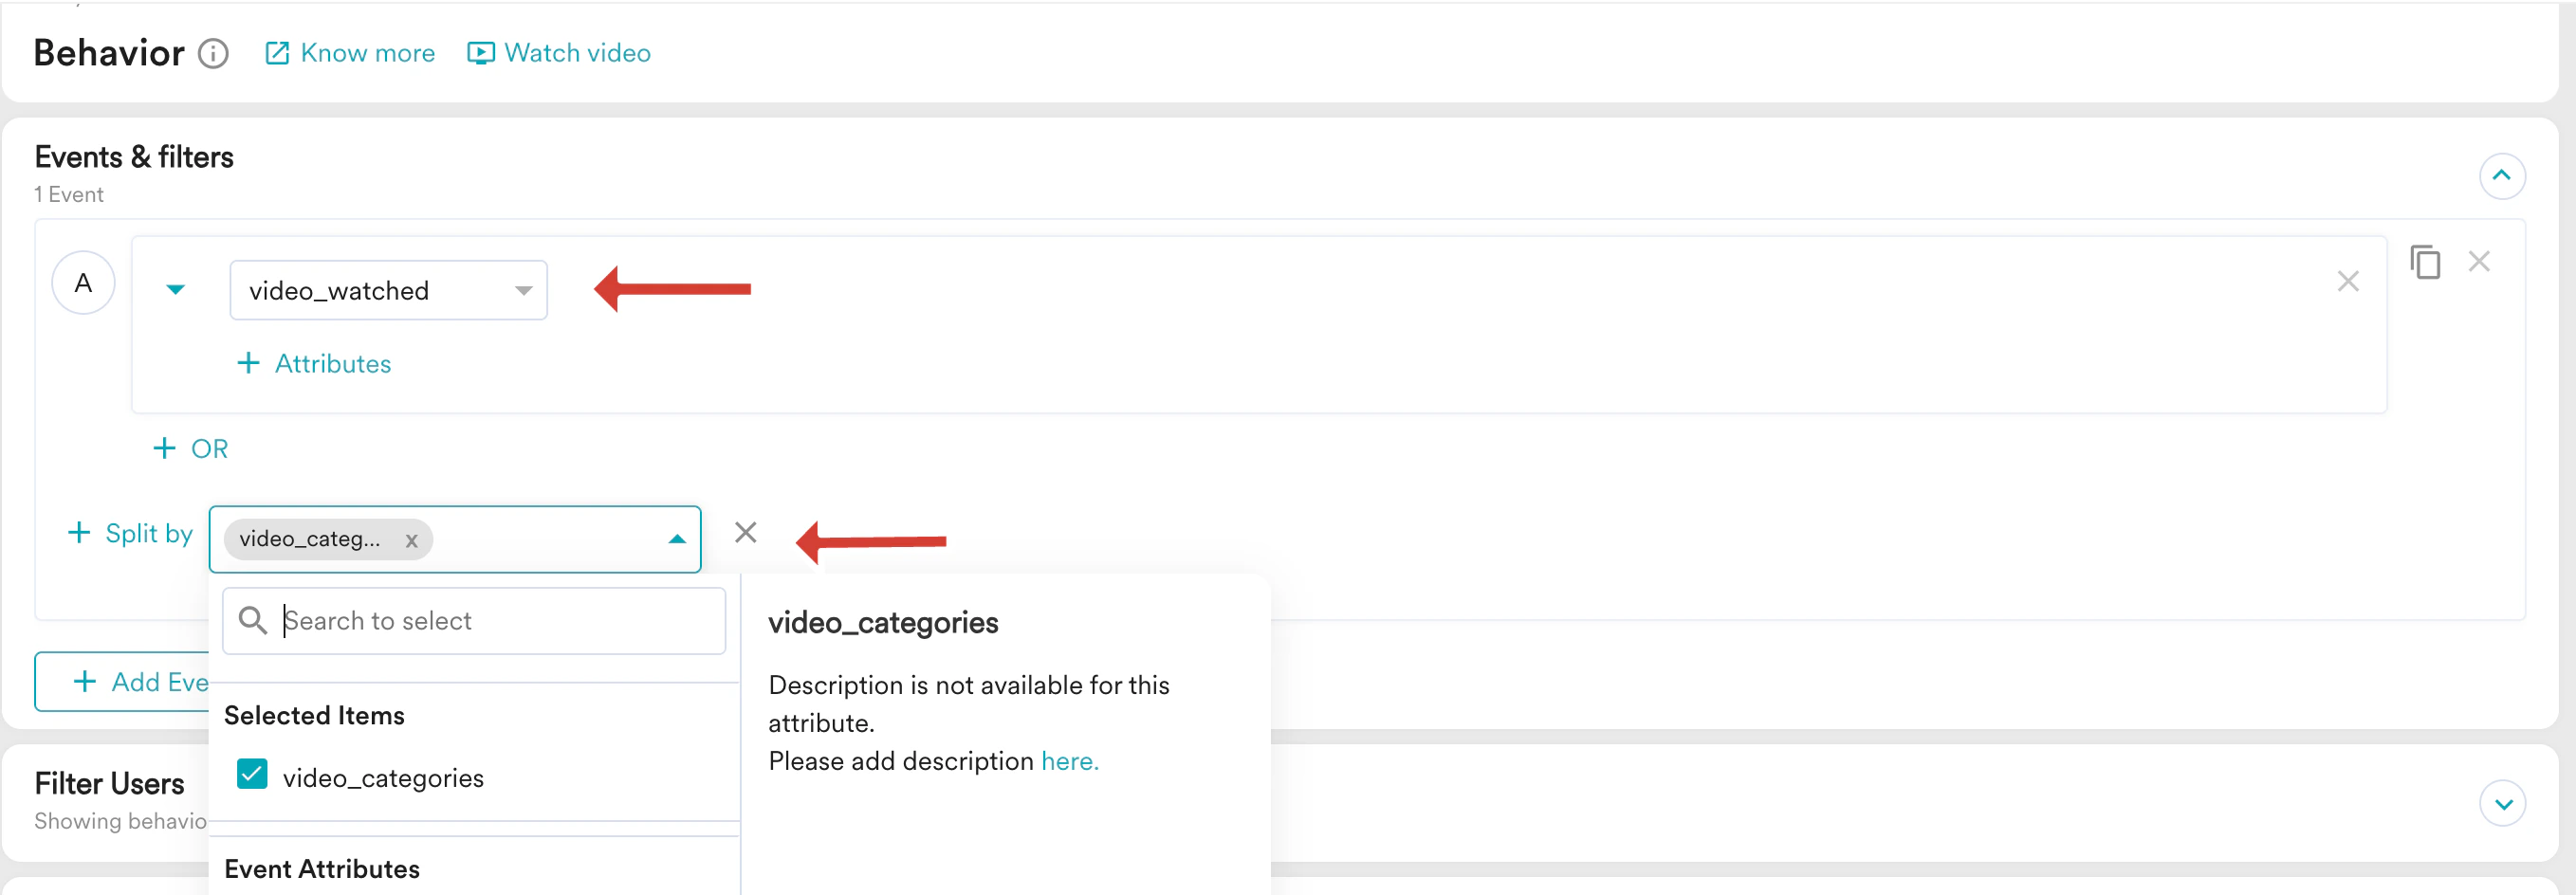
 2. Add your content viewed event.
3. From the **Split by** drop-down list, split based on category event attribute.
2. Add your content viewed event.
3. From the **Split by** drop-down list, split based on category event attribute.
 4. Select your required option from the **Analysis type** drop-down and the **Duration** field.
 5. Click **Apply**.
6. Select your comparison duration.
5. Click **Apply**.
6. Select your comparison duration.
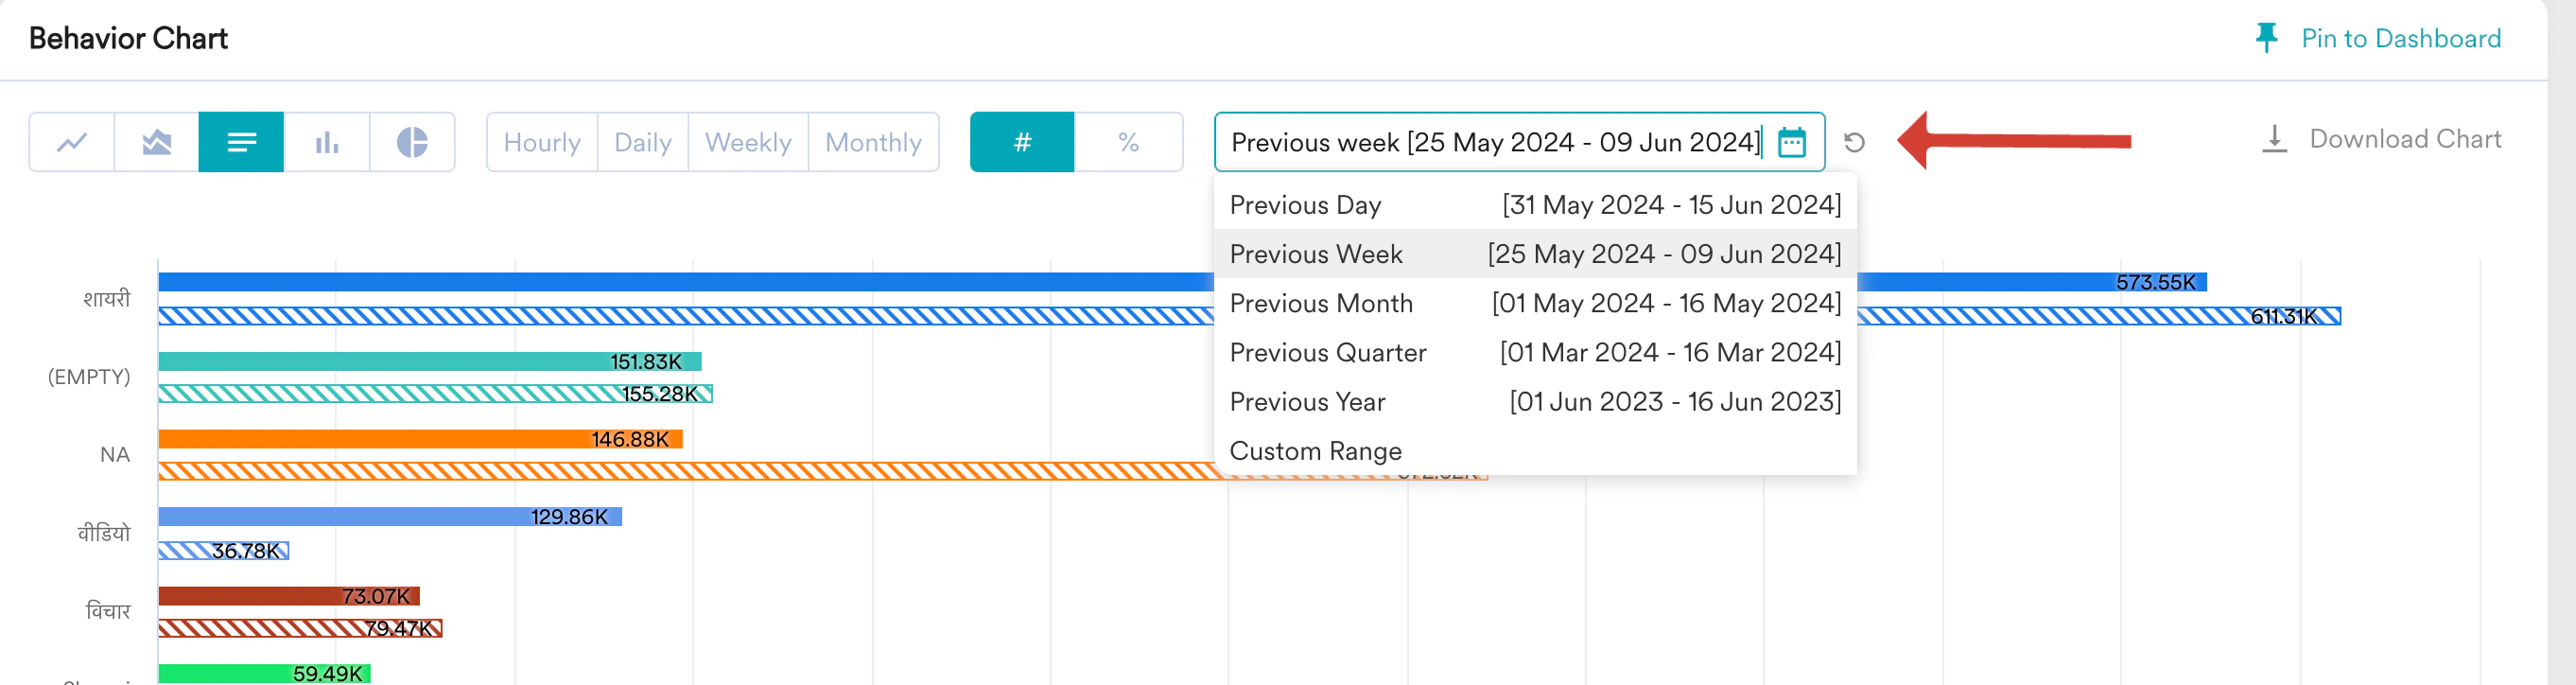 **Result**: Time-series comparison of different categories of videos present across your app or site.
## Compare Based on Retention
In this section, let us compare based on retention.
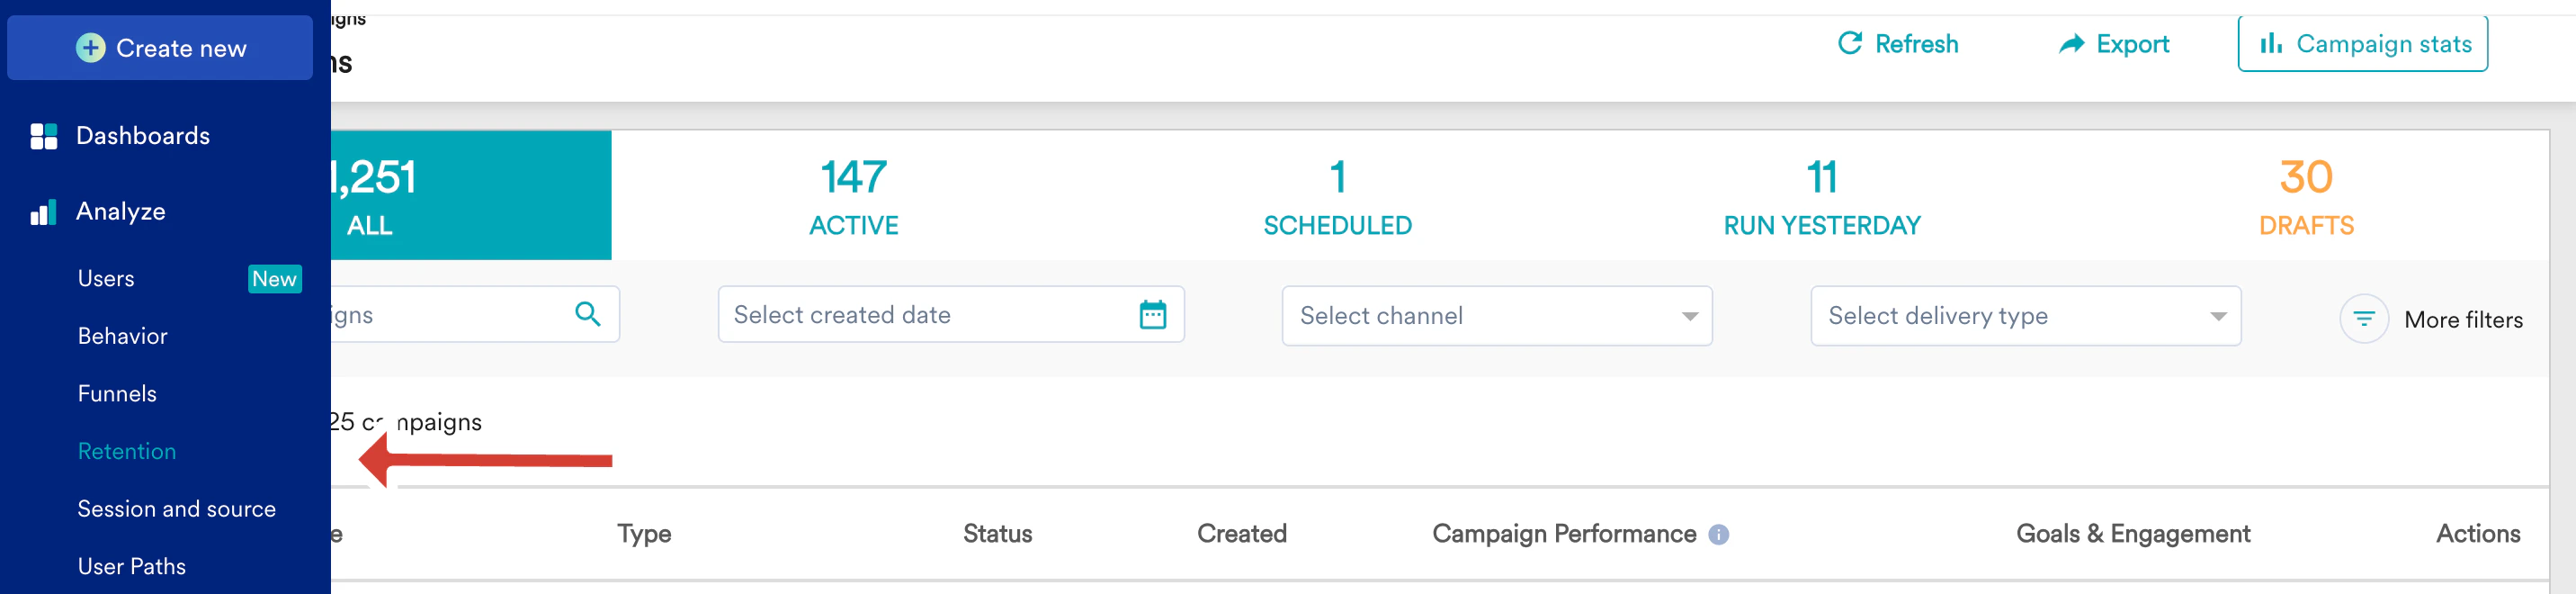
1. Navigate to **Analyze** > **Retention** on your MoEngage Dashboard.
**Result**: Time-series comparison of different categories of videos present across your app or site.
## Compare Based on Retention
In this section, let us compare based on retention.
1. Navigate to **Analyze** > **Retention** on your MoEngage Dashboard.
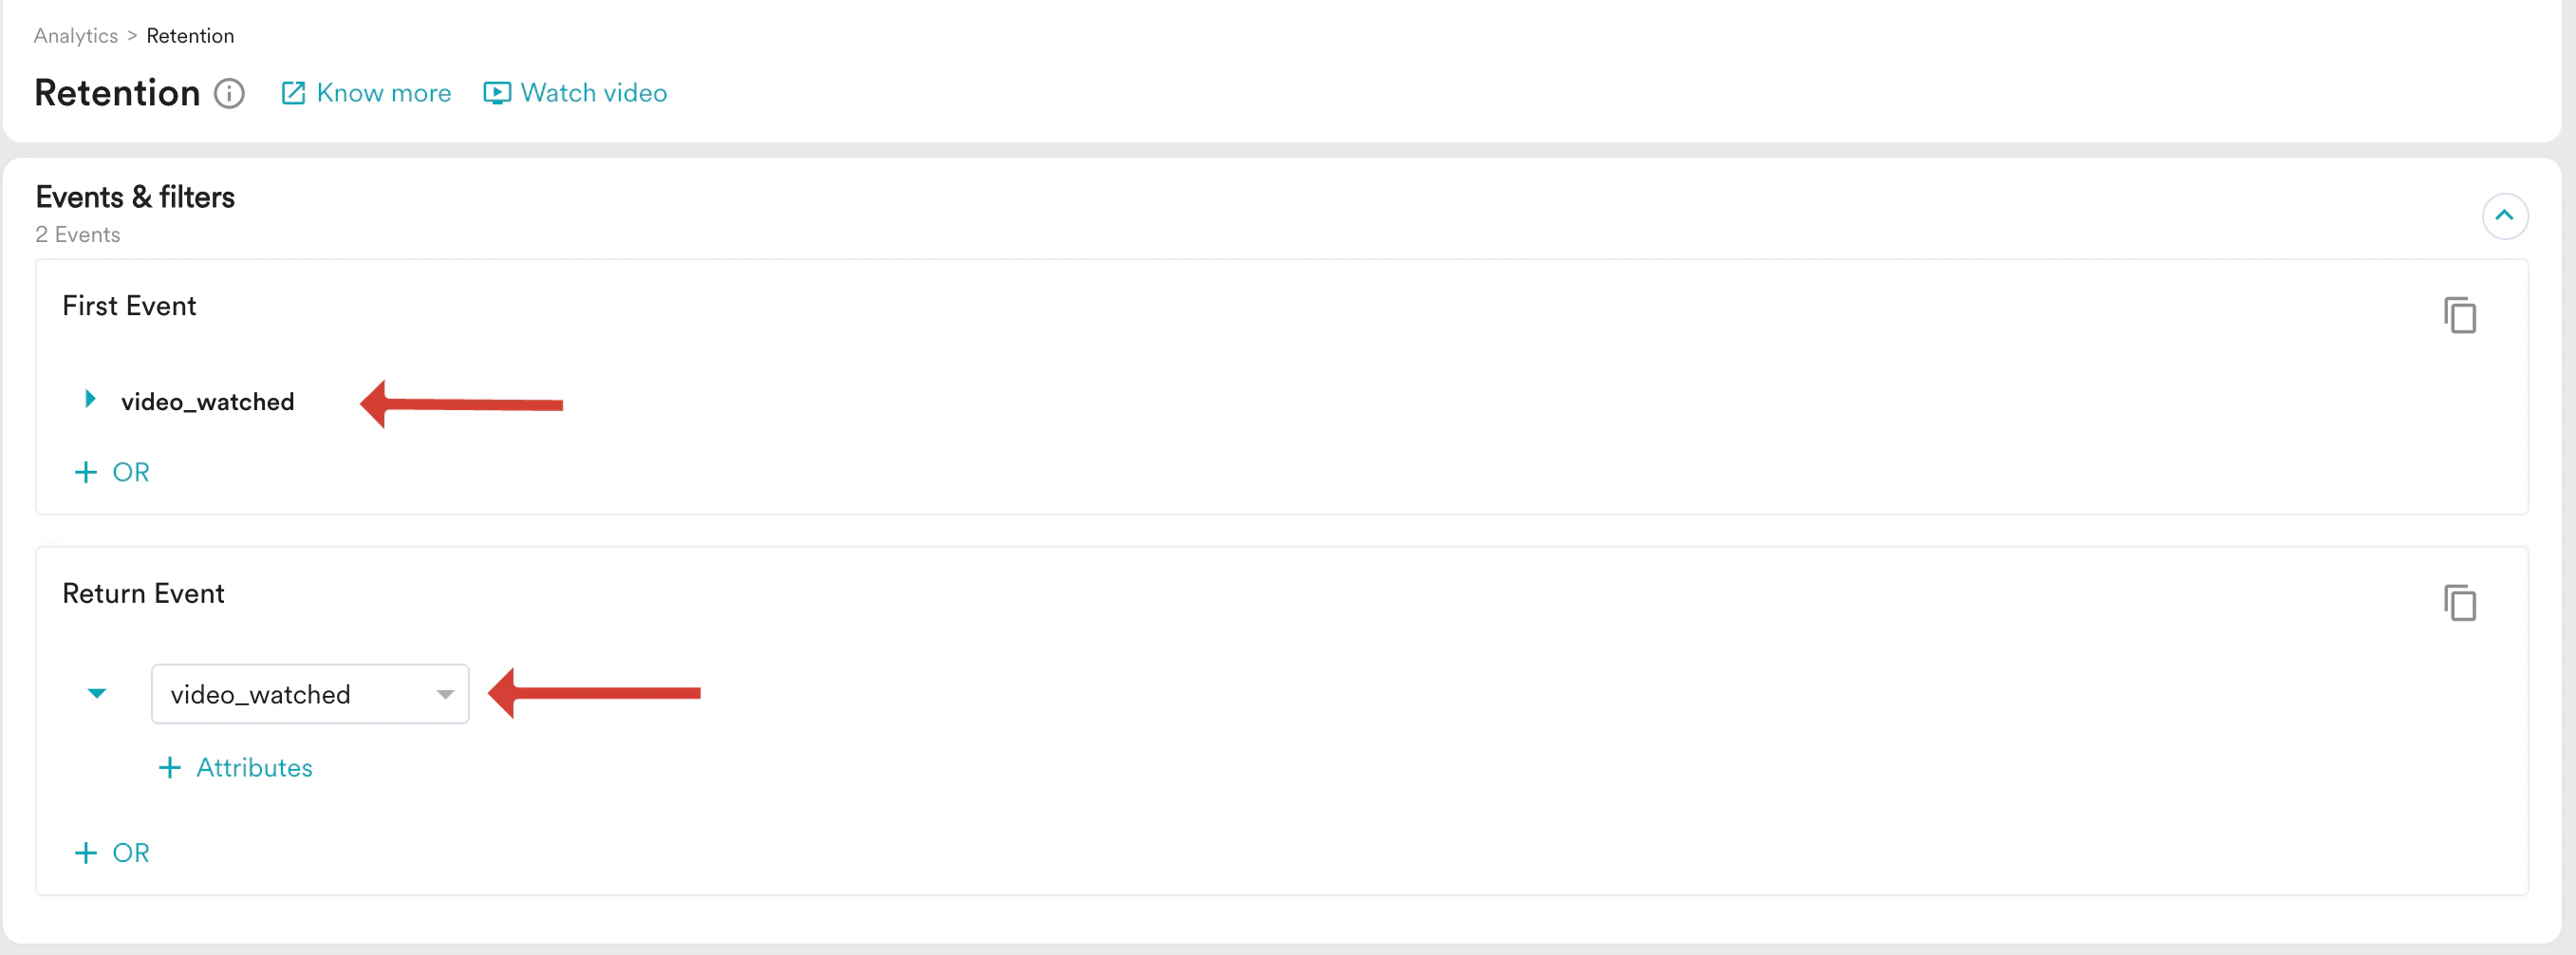
 2. Select your first event and returning event.
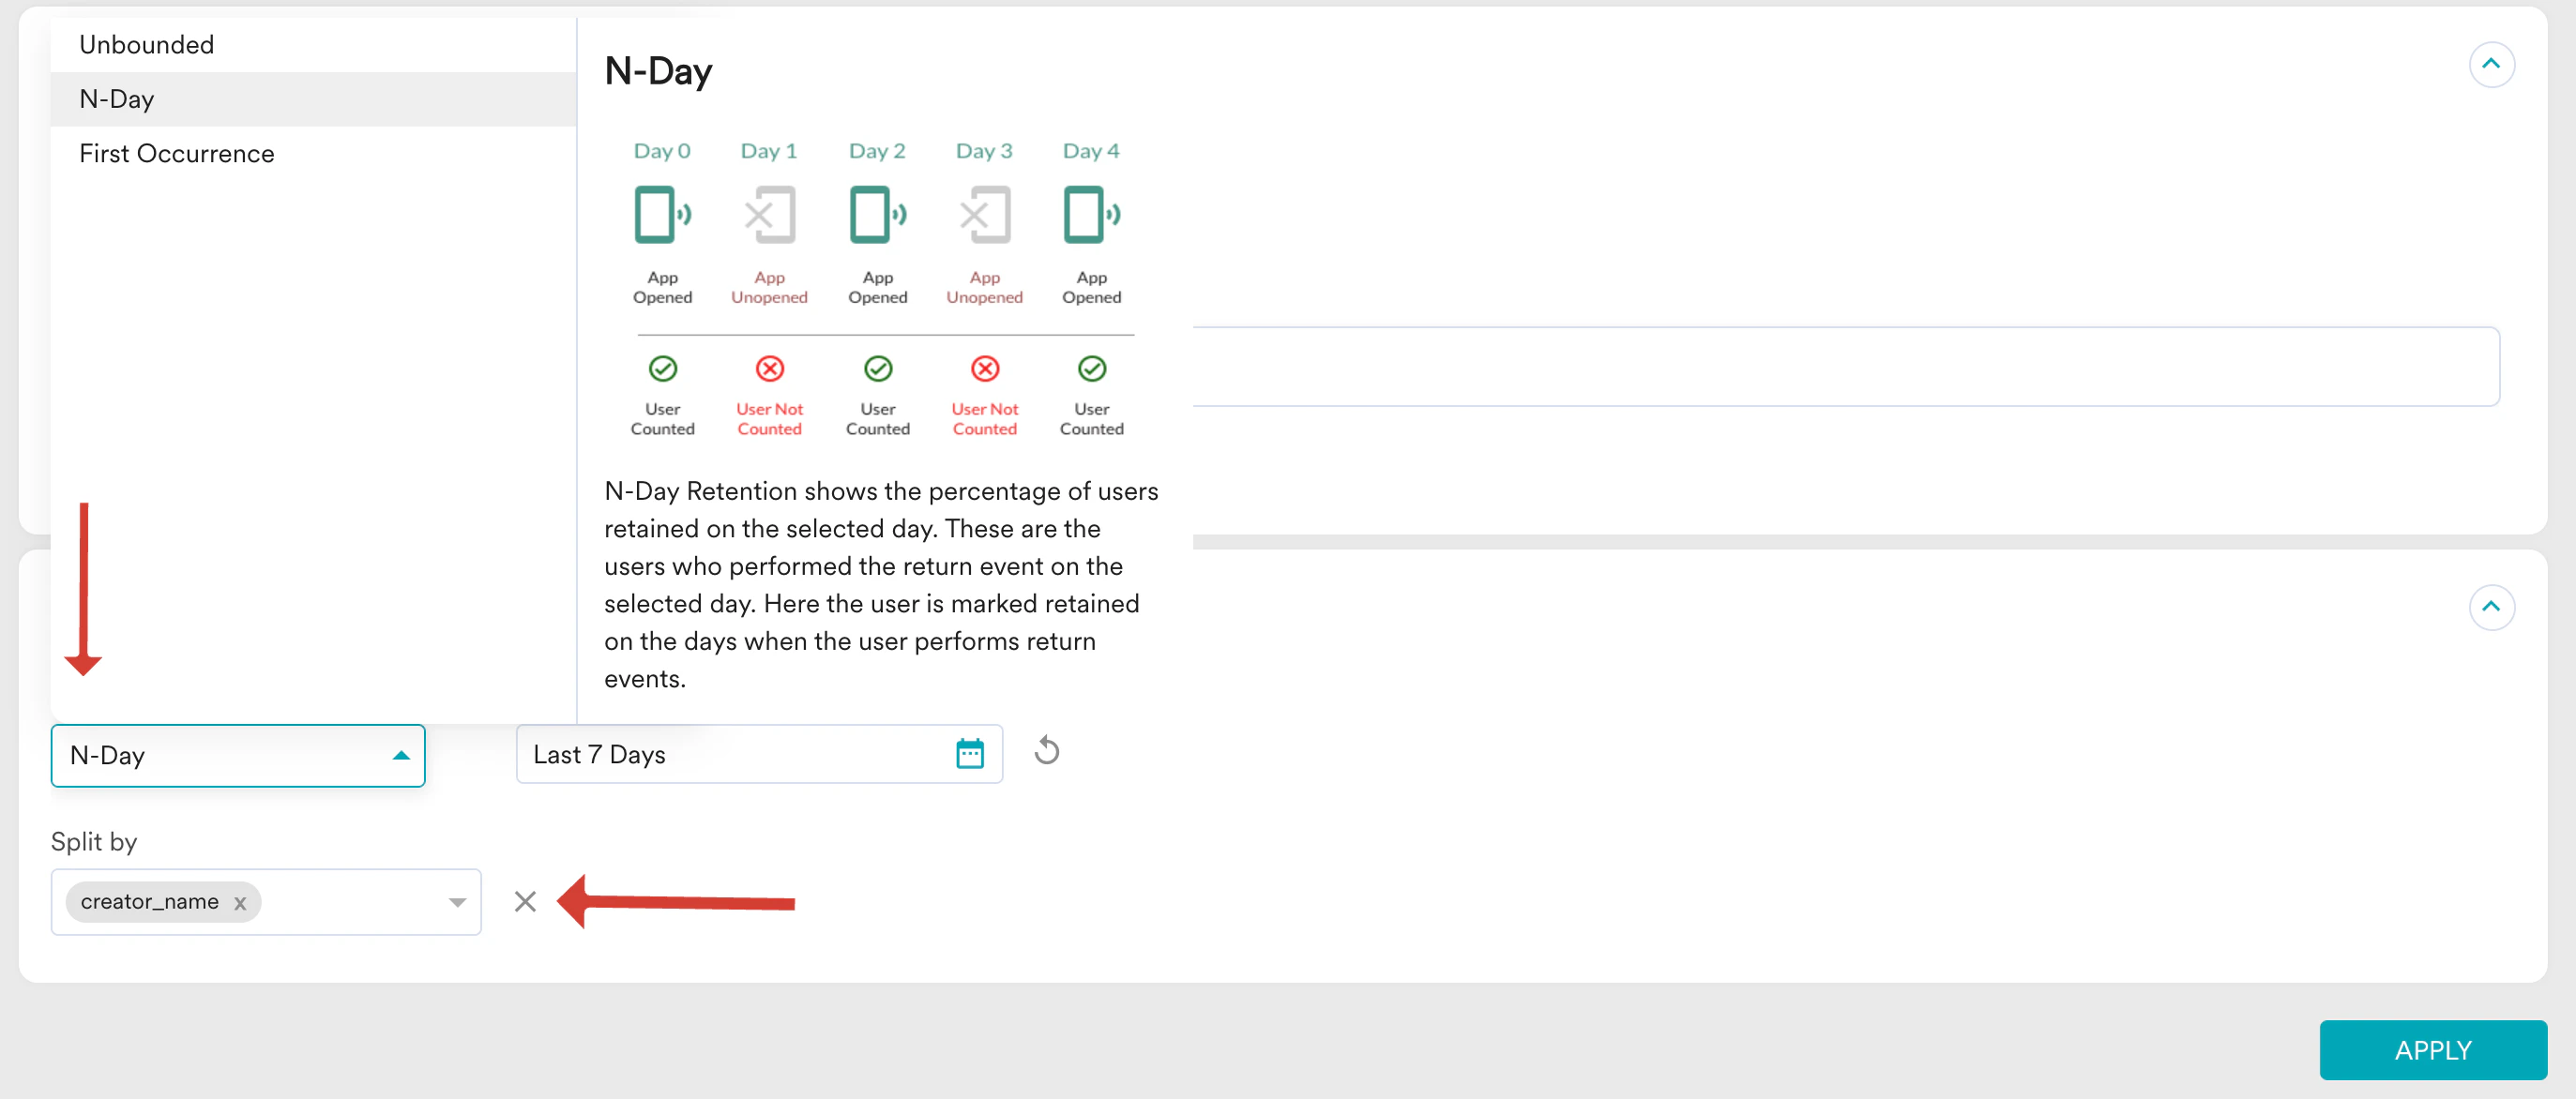
 3. In the **Retention Options** section, from the **Retention type** drop-down, select your retention type.
4. From the **Split by** drop-down list, split by the video creator name.
5. Click **Apply**.
3. In the **Retention Options** section, from the **Retention type** drop-down, select your retention type.
4. From the **Split by** drop-down list, split by the video creator name.
5. Click **Apply**.
 **Result**: Daily Retention chart of videos watch of different video creators whose content is present on your app or site.
# Conclusion
In this use case, we understood how you can analyse different content viewership on your app or site in terms of engagement and retention.
This is how you can analyse your content performance in terms of their categories, names, or creators in MoEngage. This will help simplify decision making on what type of content is generating more viewership and improving user retention.
**Result**: Daily Retention chart of videos watch of different video creators whose content is present on your app or site.
# Conclusion
In this use case, we understood how you can analyse different content viewership on your app or site in terms of engagement and retention.
This is how you can analyse your content performance in terms of their categories, names, or creators in MoEngage. This will help simplify decision making on what type of content is generating more viewership and improving user retention.