> ## Documentation Index
> Fetch the complete documentation index at: https://moengage.com/docs/llms.txt
> Use this file to discover all available pages before exploring further.
# Debugging Mode
> Enable debug logging in the MoEngage Web SDK to troubleshoot integration issues in the browser console.
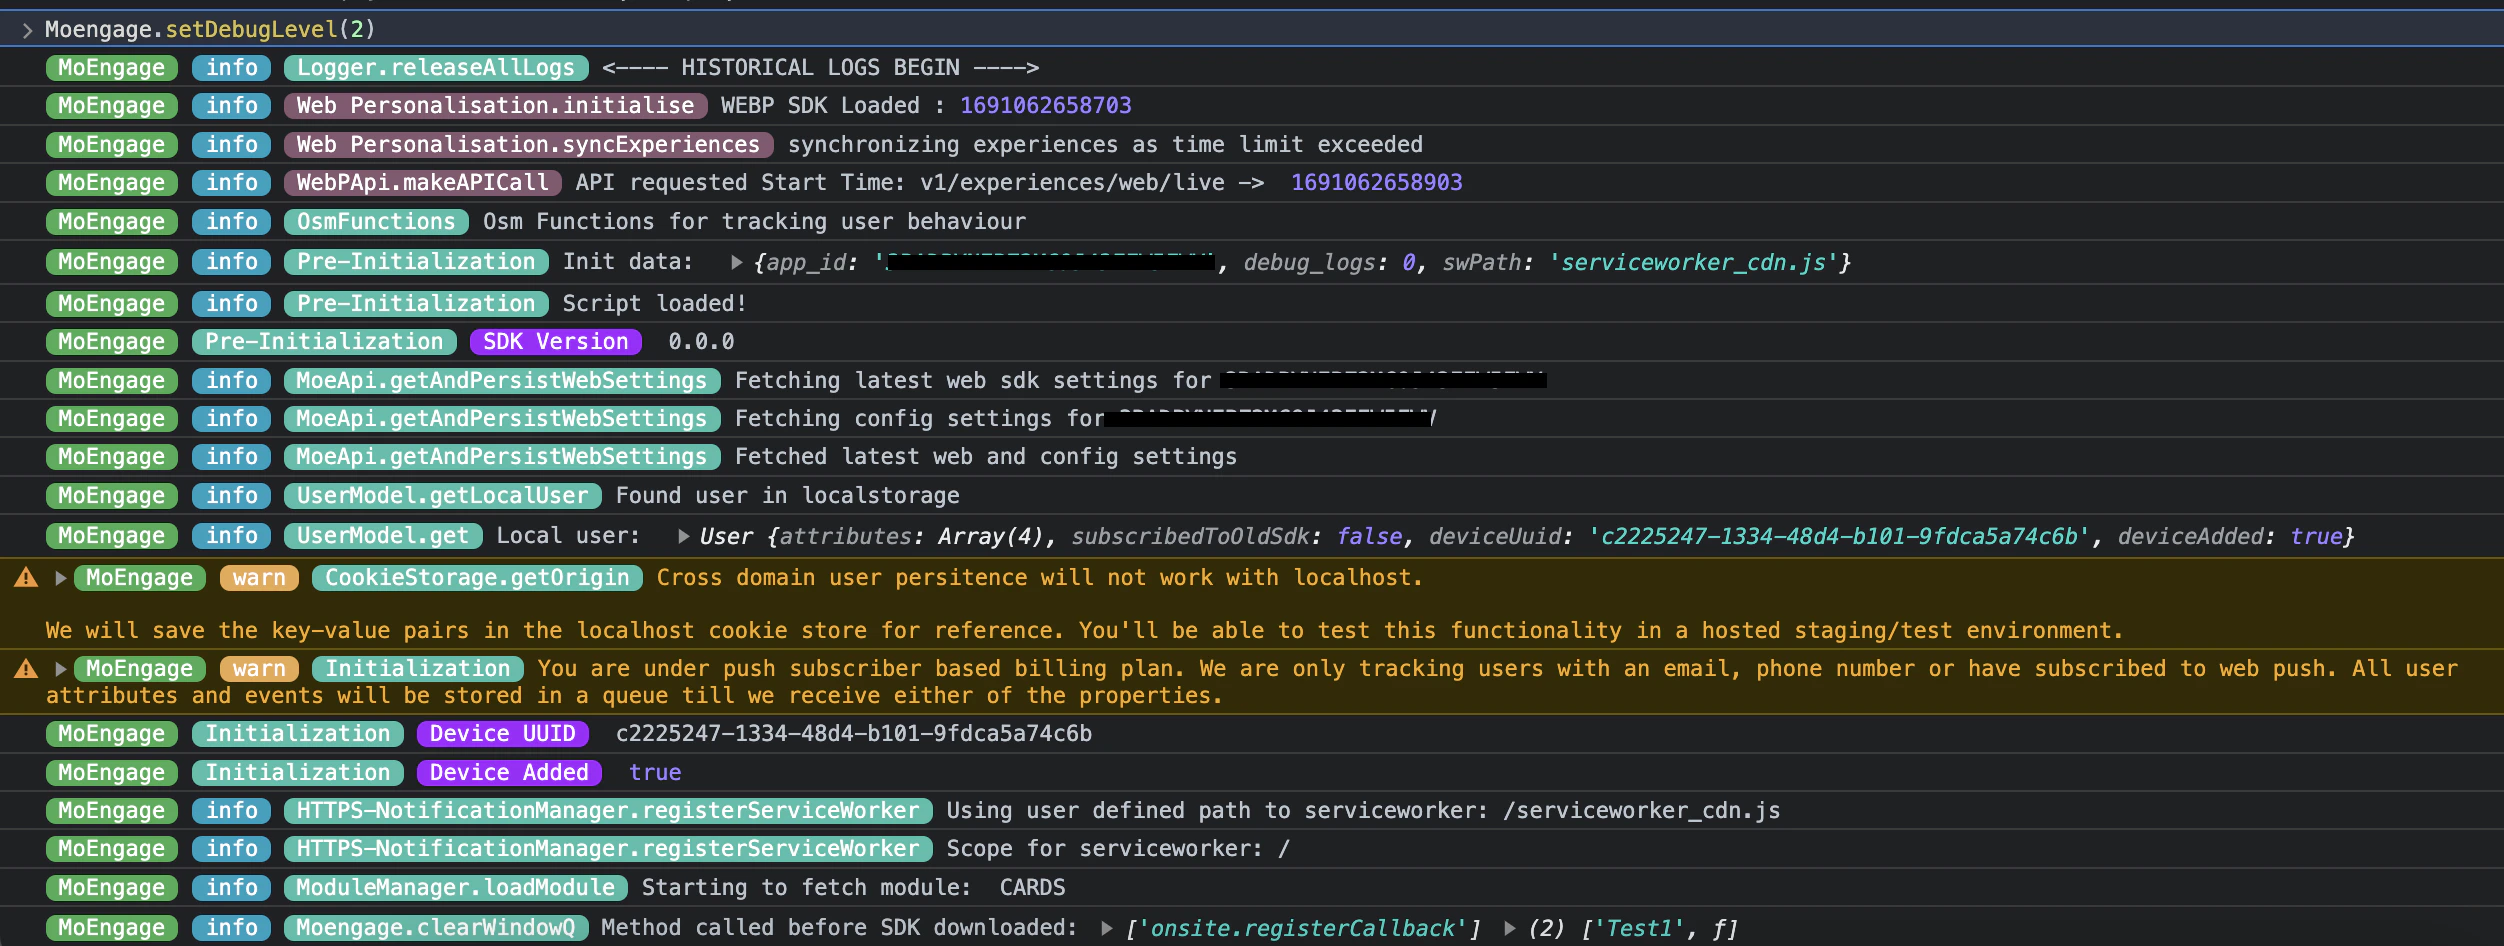
The SDK logs a wealth of useful information in debug mode. This mode is automatically activated when loading the SDK in a **Test** environment.
However, to view these logs in a **Live** environment, enter the following command in the **Console** section of your browser's developer tools:
```javascript JavaScript theme={null}
Moengage.setDebugLevel(2)
```
Enabling this allows you to see detailed logs that help debug incorrect integrations, presented in a clear, color-coded format:
 ## Multiple Integrations
The SDK may behave unexpectedly if it is added to your website more than once. If this occurs, and debug mode is enabled, you will see the following error message in the browser console:
`MoEngage Web SDK initialised multiple times. Please integrate the Web SDK only once!`
This error message will only appear if you are using the latest SDK integration code as specified in the documentation.
## Multiple Integrations
The SDK may behave unexpectedly if it is added to your website more than once. If this occurs, and debug mode is enabled, you will see the following error message in the browser console:
`MoEngage Web SDK initialised multiple times. Please integrate the Web SDK only once!`
This error message will only appear if you are using the latest SDK integration code as specified in the documentation.